There were 36 gubernatorial elections in 2018. Heading into Election Day, Republicans held 26 of those seats, Democrats 9, with one independent. Republicans won 20 of the races, Democrats 16, for a net Democratic gain of 7 governorships. By picking up the independent-held seat in Alaska, the GOP net loss was six.
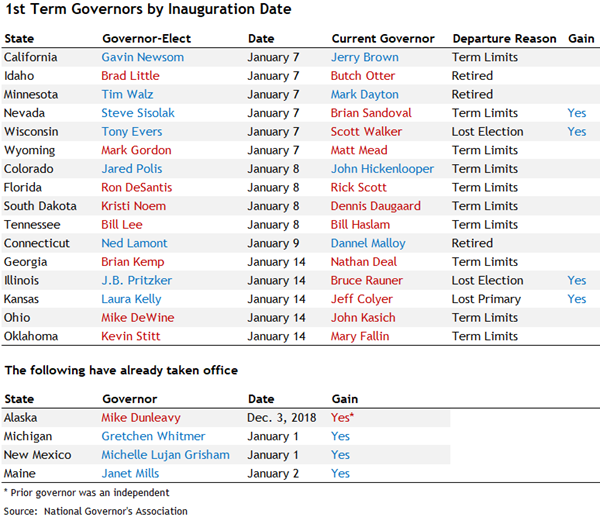
There were a large number of retirements in 2018, mostly due to term limits. By mid-January, when the inaugurations are complete, 20 of the country's 50 state governors will be new to the job.
The 116th Congress got underway at noon on Thursday. We've updated our Who Represents Me look-up tool to reflect the new Congress, as well as governors elected in November. Use the search box to look up information for a specific address, Zip Code, city or state.
Many of the new governors have not yet taken office; we note that where applicable. Some of the contact and social media information in these listings will likely be incomplete in the near-term. It is gathered from 3rd party sources; we do not control how quickly those sources make updates.
As it does each December, the Census Bureau released an update of U.S. population figures as of July 1st. Total U.S. population increased about 0.6% to 327,167,434 from 2017. Nevada, Idaho and Utah were the fastest growing states at about 2% each. Texas and Florida gained the most people - over 300,000 each, more than twice as many as any other state. Nine states lost population, led by New York and Illinois.
The new figures also allow for extrapolation of population changes by state out to 2020, when the next Census will take place. The actual population figures from the 2020 Census will determine the number of congressional districts in each state over the next decade. It will also lead to a change in the electoral map, as each state receives electoral votes equal to its total congressional delegation (House + Senate). The new electoral map will be effective for the 2024 presidential election.
The map below shows how the 2016 election would have turned out if the projected 2024 map had been in place. It is based on the long-term population trends (2010-18), but the map is exactly the same if we look at medium-term trends (2014-18). Donald Trump would have received three additional electoral votes, giving him 309*. Click or tap the image for an interactive version of the map for each presidential election from 2000 through 2016.
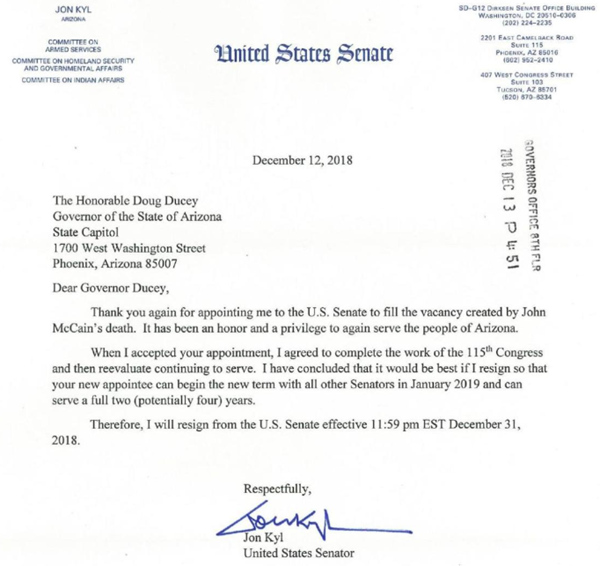
Arizona Gov. Doug Ducey appointed Rep. Martha McSally to fill the U.S. Senate seat being vacated by Sen. Jon Kyl. Ducey's office made the announcement on Tuesday. Kyl's departure is effective at year-end; McSally will presumably be seated when the new Congress convenes the following week.
Kyl was appointed by Ducey after Sen. John McCain's death in August. McCain's seat is next up for a full six-year term in 2022. The timing of the initial replacement requires a special election to be held in November, 2020, for the final two years of that term. Given that McSally was just on the ballot for Arizona's other U.S. Senate seat - she lost a close race to Democrat Kyrsten Sinema - we'd expect her to run in that 2020 election.
Tennessee Senator Lamar Alexander said Monday that he would not seek a 4th term in 2020. Alexander becomes the first member of Congress to announce their retirement since the 2018 midterms.
Republican Arizona Sen. John Kyl will resign his seat at year-end. Kyl was appointed to the seat after the death of John McCain in August. The state's governor, Doug Ducey, will appoint a successor, who will serve until a special election is held in November, 2020. The winner of that race will serve the remainder of McCain's six-year term. The seat is next up in 2022. Possible replacements include Rep. Martha McSally who just lost an election to Democrat Kyrsten Sinema for the state's other Senate seat. The replacement must also be a Republican, although not an issue here since the just reelected Ducey is also a member of the GOP.
The 2020 Arizona special election is looking like one of the more competitive races of that cycle, at least at this early date. Create your own forecast with our 2020 Senate interactive map.
The 2020 Senate Interactive Map is now available. 34 seats will be contested in the upcoming presidential election year, 22 of which are currently held by GOP incumbents. That's a considerably different case than this year, when Democrats had to defend 26 of the 35 seats. However, most of the 2020 GOP-held seats - and one Democratic one - are in deep-red states, limiting the paths available for Democrats to retake control.
When the new Senate is seated in January, Republicans will hold a 53-47 edge. That means in 2020, Democrats will need to gain 3 or 4 seats to win the majority. The smaller number will come about if Democrats are able to win the presidency, as a 50-50 Senate tie is broken by the Vice-President. The interactive map lets you choose which party will win the 2020 election - use the 'VP' box near Florida.
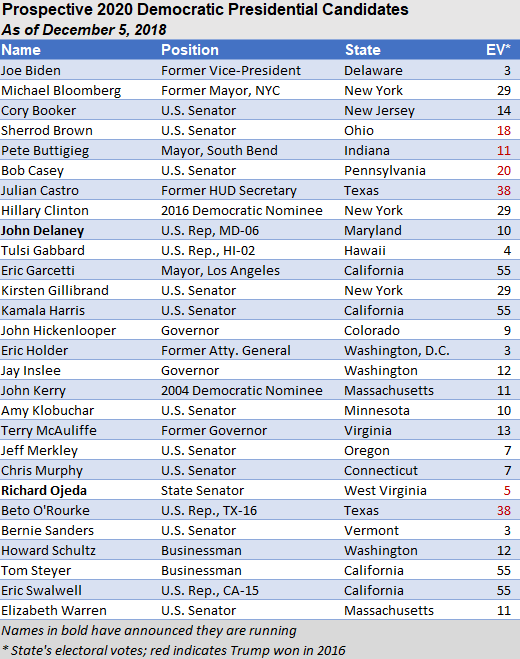
This week, former Massachusetts Gov. Deval Patrick and attorney Michael Avenatti dropped off the list of prospective 2020 Democratic presidential candidates. Patrick informed staff and advisers on Tuesday, with a public statement expected in the days ahead. Avenatti announced his decision by Twitter, citing family concerns.
That leaves 28 names on our current list of possible Democratic contenders. Only two, Rep. John Delaney of Maryland and former Rep. Ojeda of West Virginia have formally announced. We should have a pretty good idea of who is actually going to run within the next 2 to 3 months.
Maybe we're not done with the midterms after all. North Carolina officials have again declined to certify the results in the state's 9th congressional district. Allegations of voter fraud will continue to be investigated, and a hearing will be held on December 21st. The issues seem centered around absentee ballot irregularities, particularly in Bladen County.
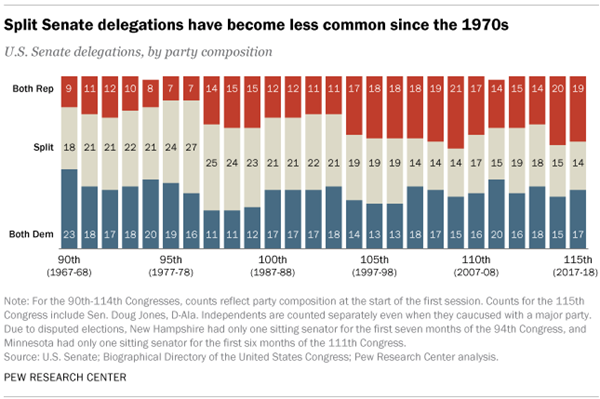
Following the 2018 midterm elections, the number of states with a split U.S. Senate delegation will drop from 14 to just 10 in 2019. This marks the fourth consecutive election with a decline. This is also just one above the historically low value* of nine split delegations set in 1955-56.
The chart below, from a Pew Research study, shows the totals by state for the past fifty years, ending before this year's midterms. After Democrat Doug Jones won a 2017 special election in Alabama, 14 states had a split delegation.