2020 Presidential Election Forecasts
These maps reflect the ratings of a number of quantitative and qualitative forecasters, as well as some consensus projections. Click or tap any of the thumbnails for an interactive version that you can use to create and share your own 2020 Presidential forecast.
Election Day Live Results: Choose a map to follow along as the votes are counted and races are called.
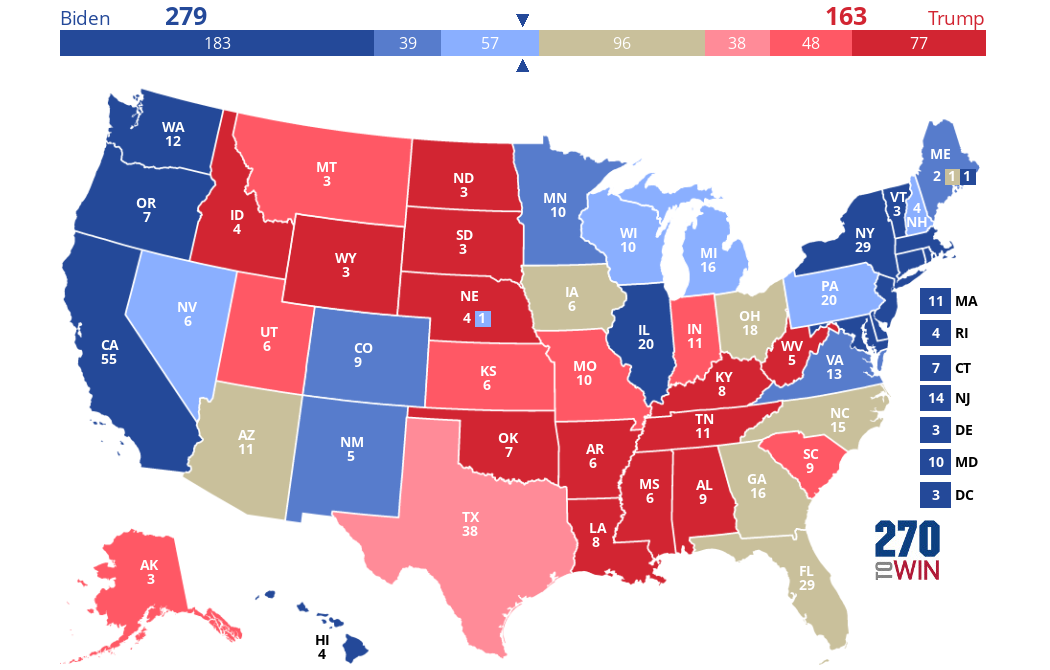
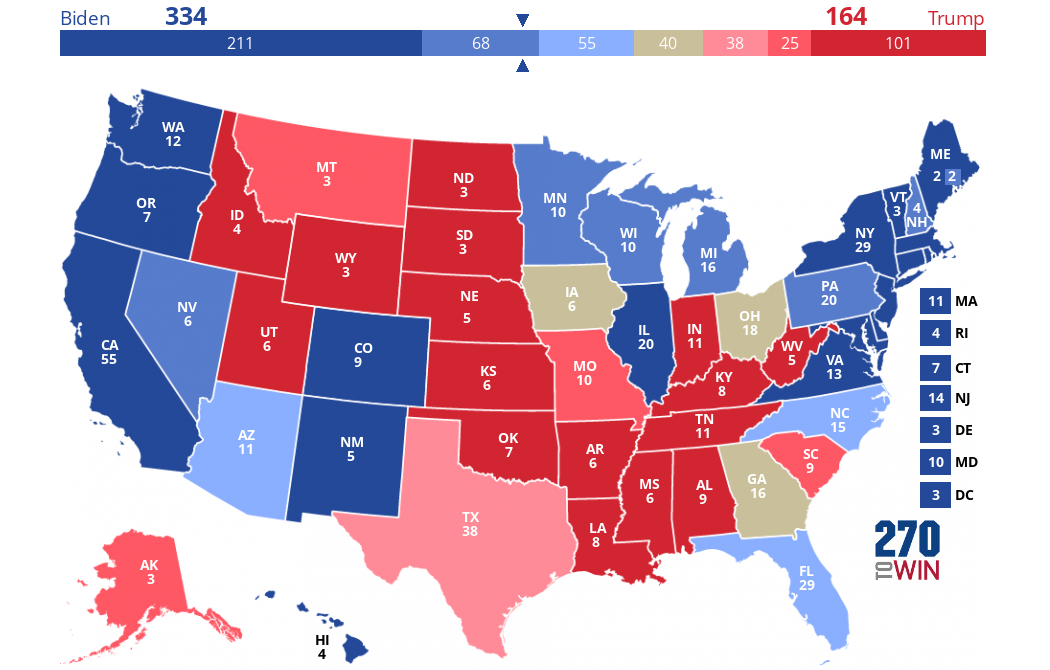
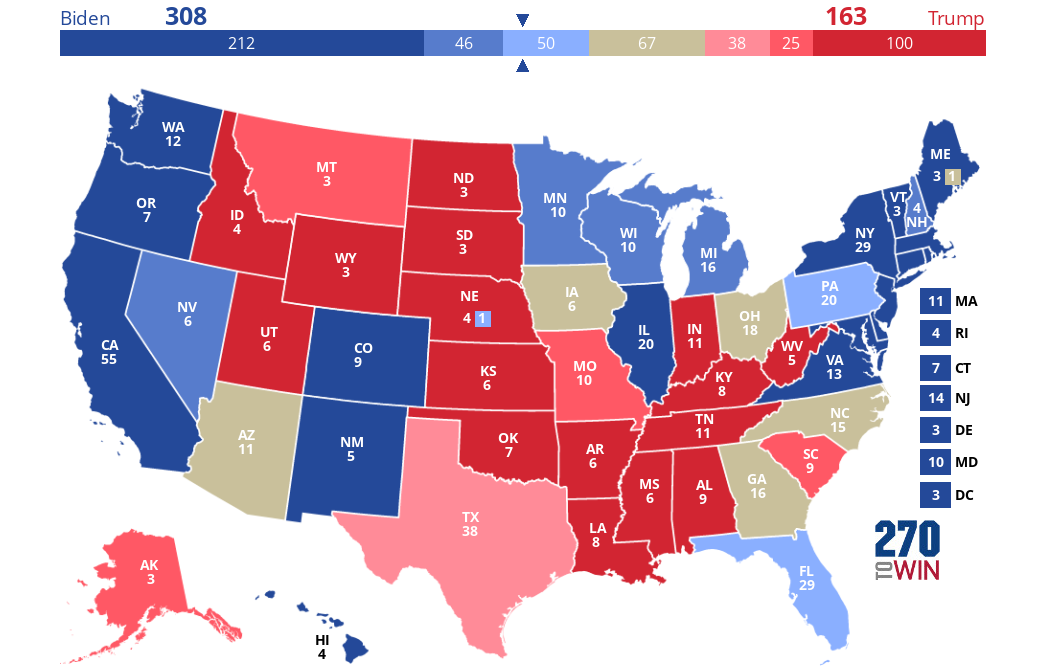
2020 President: Consensus Electoral Map
This map aggregates the ratings of nine organizations to come up with a consensus forecast for the 2020 presidential election.
Use the timeline feature to view the map as it looked at the end of each day.
Use this map as a starting point to create and share your own 2020 electoral map forecast.
November 3: Arizona moves from Leans Democratic to Toss-up.
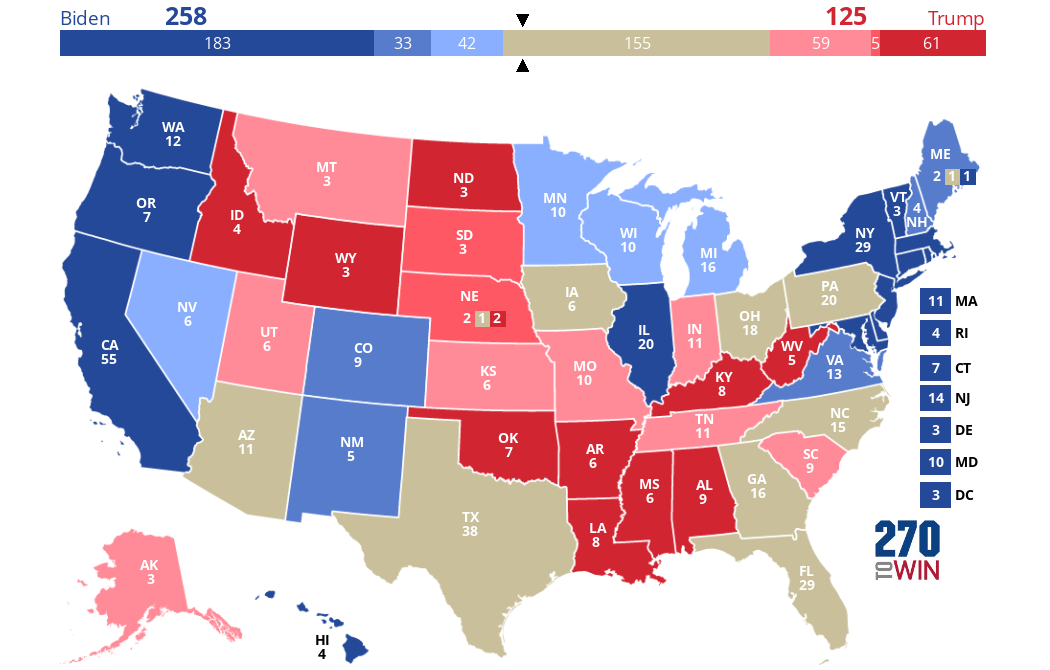
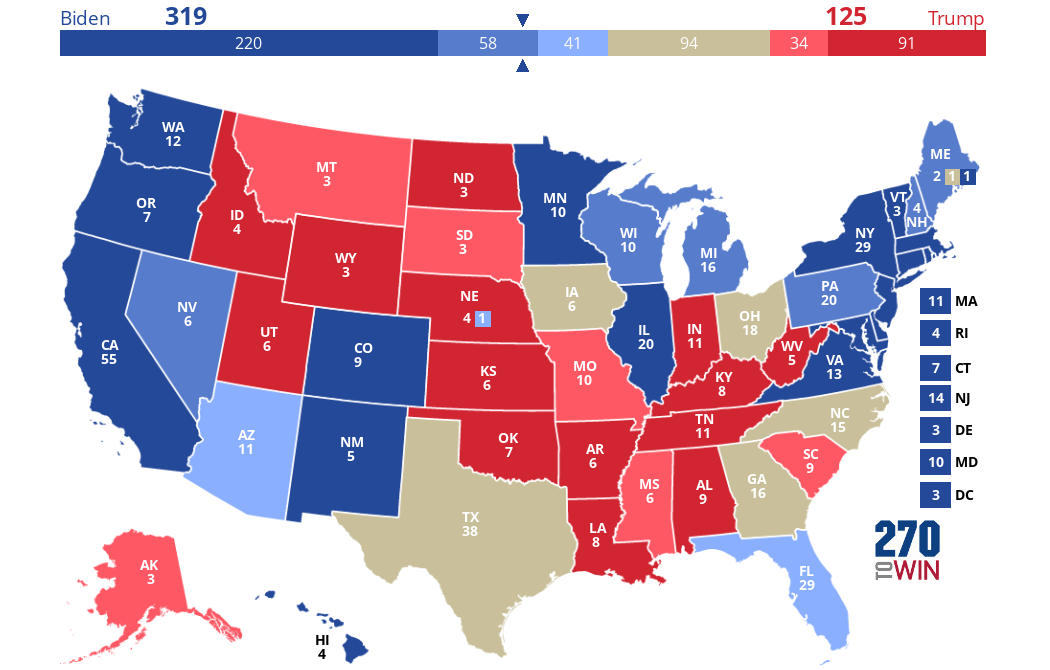
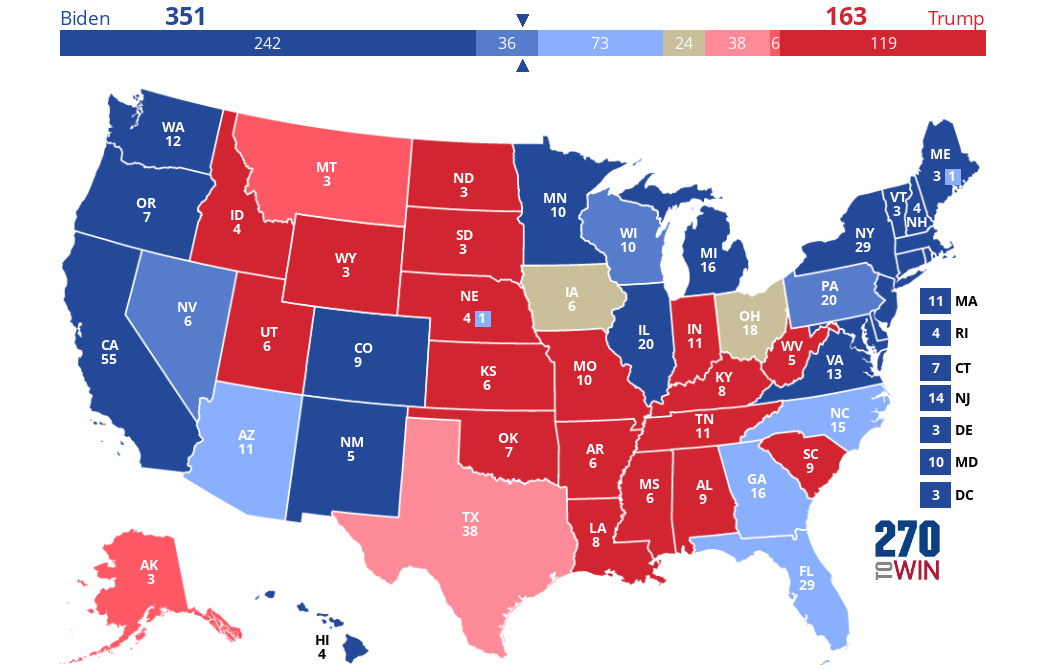
2020 Electoral Map Based on Polls
Updated three times daily, this map tracks the electoral vote count for the 2020 presidential election based on polling. The 2016 election margin, rounded to the nearest 1%, is used where there are no polls.
Use the timeline feature to view the map based on the final update each day.
States where the margin is <5% are shown as toss-up. Leaning is <10%, likely <15%. Safe is 15% or higher.
Use this map as a starting point to create and share your own 2020 presidential election forecast.
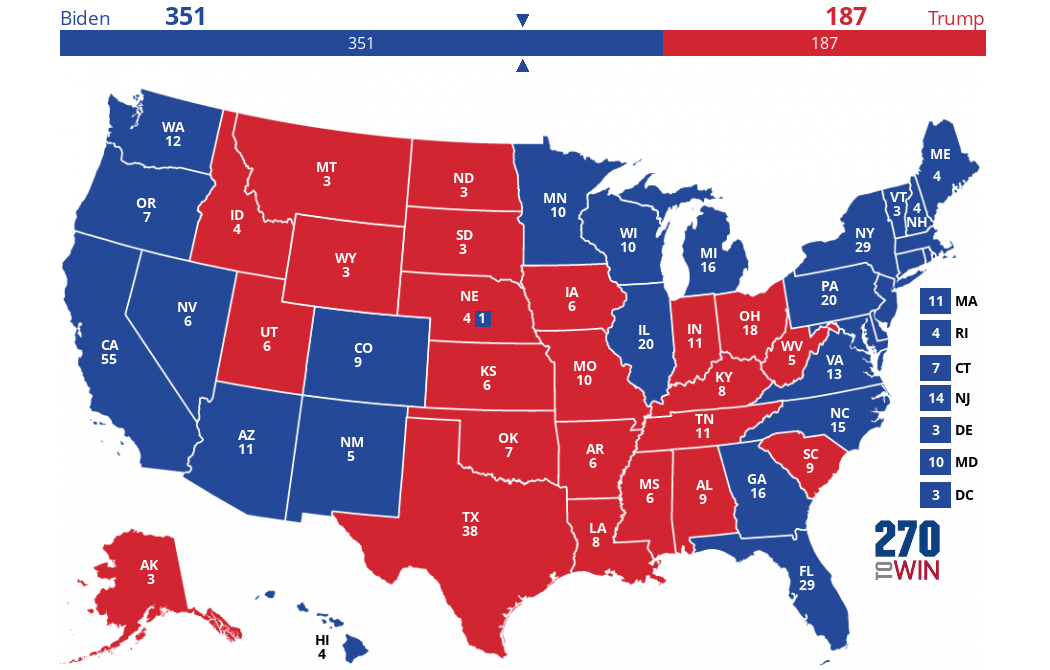
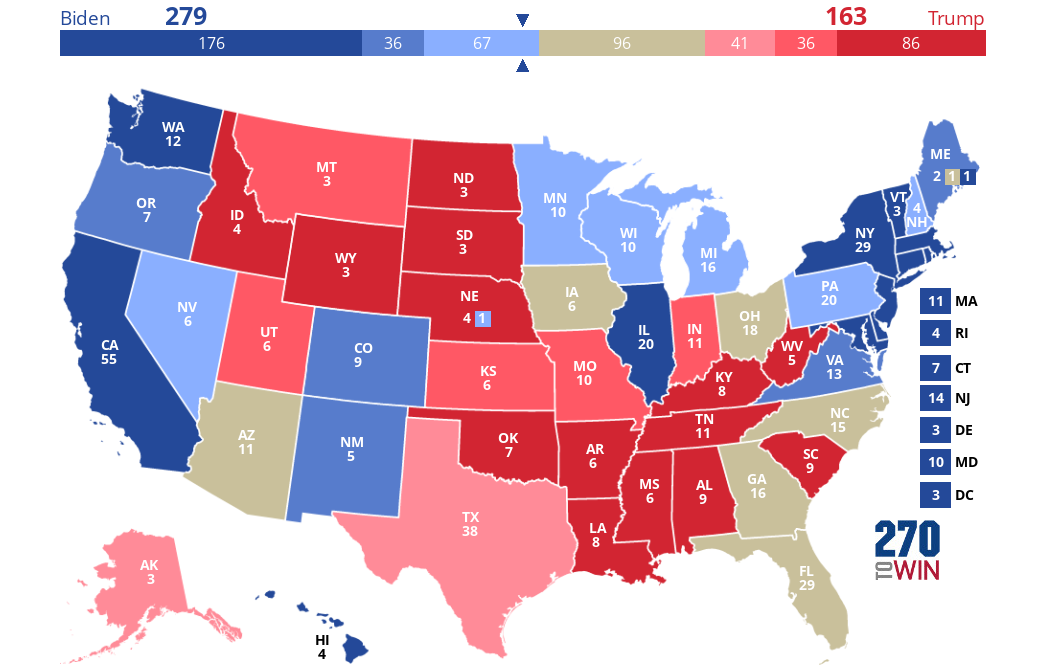
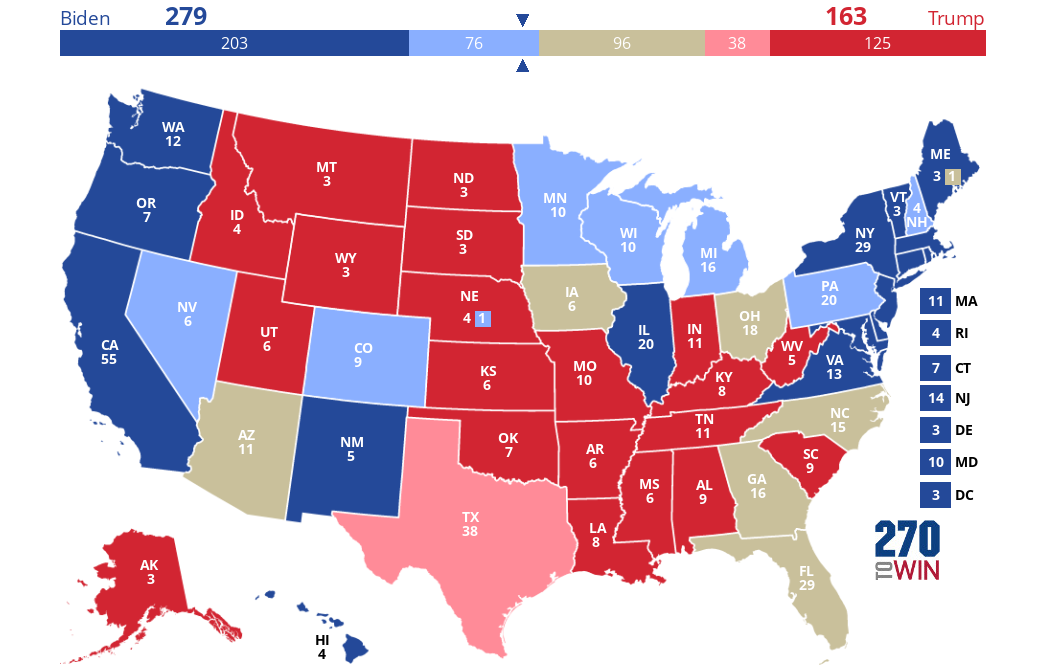
2020 Map Based on Polls (No Toss-ups)
Updated three times daily, this map will track the electoral vote count based on polling, with no toss-ups (unless exactly tied).
The candidate that leads in the polls is shown as the winner of the state. The 2016 party winner is used where there are no polls.
See the regular Biden-Trump Polling Map for more granular ratings based on the margin between the two nominees.
Use this map as a starting point to create and share your own 2020 presidential election forecast.

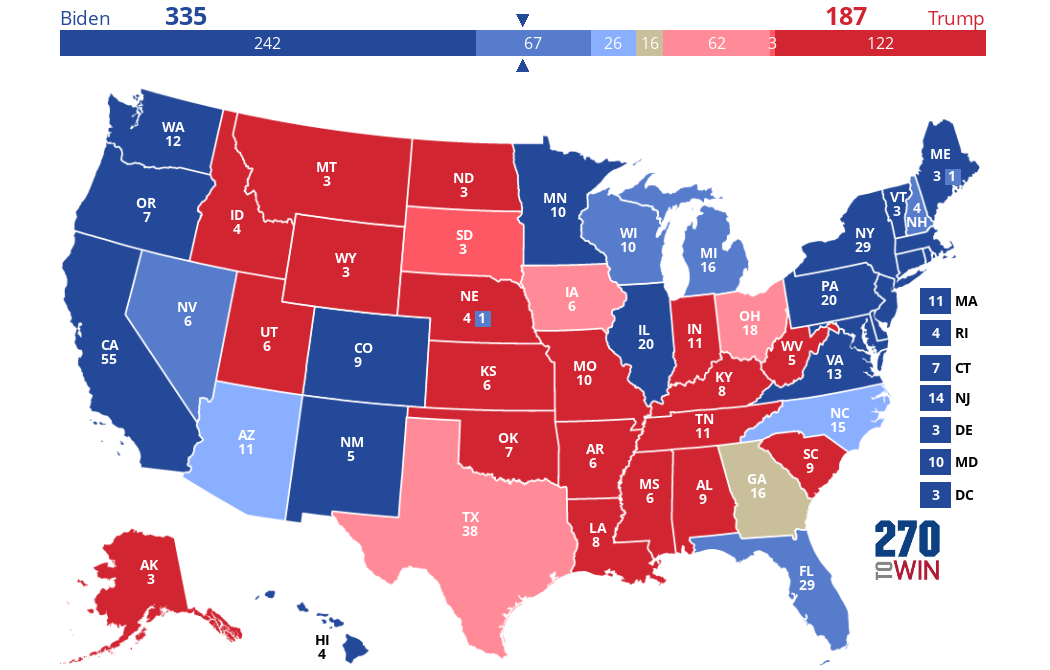
Cook Political Report Electoral College Forecast
The current ratings for the 2020 presidential election from The Cook Political Report. Use this as a starting point to create and share your own 2020 presidential election forecast.
October 28: Texas moves from Leans Republican to Toss-up. Read Amy Walter's analysis here.
Inside Elections Presidential Ratings
The current ratings for the 2020 presidential election from Inside Elections. Use this as a starting point to create and share your own 2020 presidential election forecast.
October 28: Georgia and North Carolina move from Toss-up to Tilt Democratic; Texas from Tilt Republican to Toss-up.
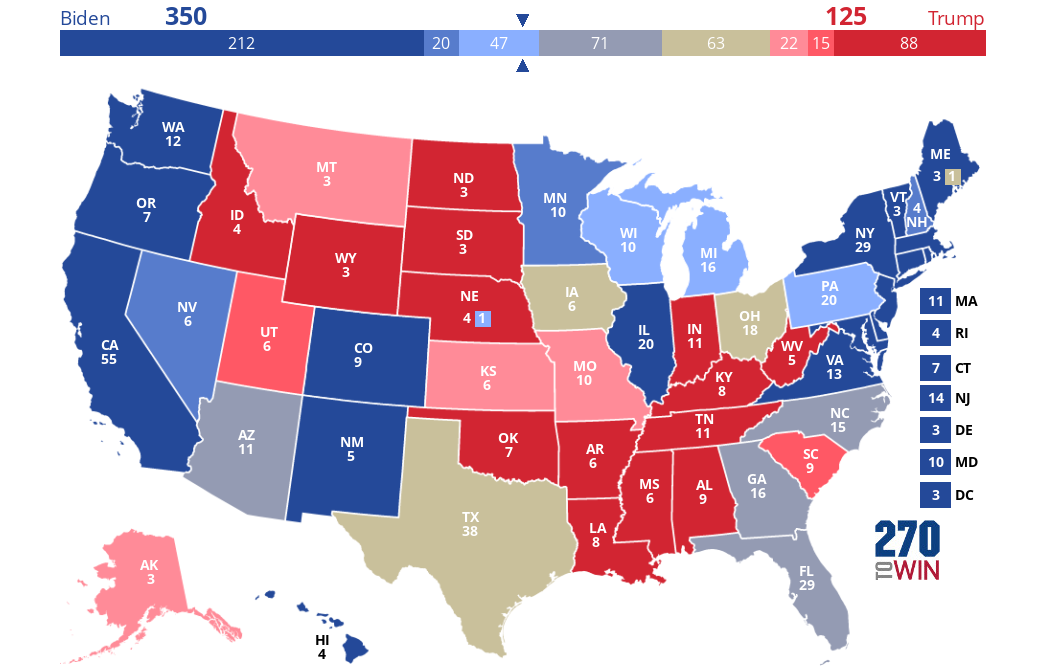
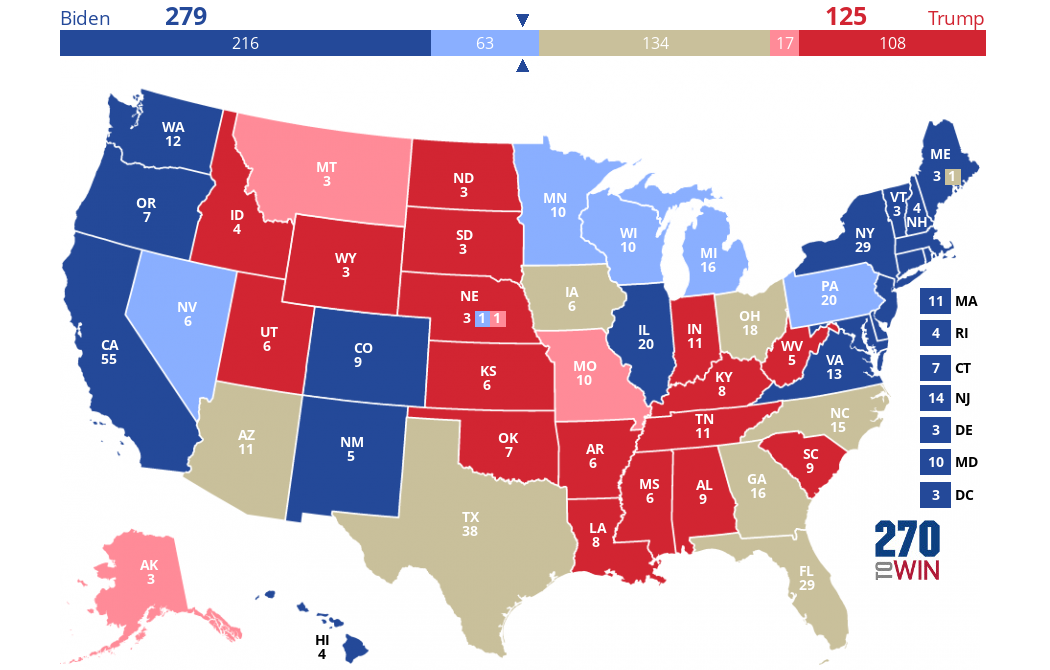
The Economist's US Presidential Election Forecast
Updated twice daily, this is an electoral map projection based on The Economist's US presidential election forecast.
Use the timeline feature to view the map based on the final update each day.
The Toss-Up tan color is used where neither candidate currently has a 65% or higher chance of winning. The colored gradients are used to show higher probabilities for Biden or Trump, deepening as the likelihood of winning increases: Light (65%+), Medium (85%+), Dark (99%+).
Use this map as a starting point to create and share your own 2020 presidential election forecast.
FiveThirtyEight 2020 Election Forecast
Updated every two hours, this is an electoral map projection derived from the FiveThirtyEight 2020 Election Forecast.
Use the timeline feature to view the map as it looked at the end of each day.
The Toss-Up tan color is used where neither candidate currently has a 65% or higher chance of winning. The colored gradients are used to show higher probabilities for Biden or Trump, deepening as the likelihood of winning increases: Light (65%+), Medium (80%+), Dark (95%+).
Use this map as a starting point to create and share your own 2020 presidential election forecast.
Politico 2020 Presidential Forecast
The final ratings for the 2020 presidential election from Politico. Use this as a starting point to create and share your own 2020 presidential election forecast.
November 2: Alaska moves from Likely to Leans Republican; Georgia from Leans Republican to Toss-up; Indiana from Safe to Likely Republican.
Princeton Election Consortium
Part of the Princeton Election Consortium polling-derived forecast series for the likelihood of a Biden or Trump victory in each state.
You can view the full series of three maps here.
A state is shown as toss-up where the probability is 60% or less. The colored gradients get progressively deeper as the probability increases: Leans (<80%), Likely (<95%), Safe (95%+).
Use this map as a starting point to create and share your own 2020 presidential election forecast.
Decision Desk | 0ptimus 2020 Presidential Forecast
Updated daily, this is an electoral map projection derived from the Decision Desk | 0ptimus 2020 Presidential Election Model.
The Toss-Up tan color is used where neither candidate currently has a 60% or higher chance of winning. The colored gradients are used to show higher probabilities for Biden or Trump, deepening as the likelihood of winning increases: Leans (60%+), Likely (75%+), Safe (90%+).
Use this map as a starting point to create and share your own 2020 presidential election forecast.
JHK Forecasts Presidential Election Forecast
Updated daily, this is an electoral map projection based on JHK Forecasts presidential election forecast. This data-driven model was created by Jack Kersting.
Outputs from the model drive much of the 270toWin 2020 election simulator.
The Toss-Up tan color is used where neither candidate currently has a 60% or higher chance of winning. The colored gradients are used to show higher probabilities for Biden or Trump, deepening as the likelihood of winning increases: Light (60%+), Medium (85%+), Dark (95%+).
Use this map as a starting point to create and share your own 2020 presidential election forecast.
CNN 2020 Electoral College Map
The final 2020 electoral college outlook from CNN: "Perhaps one of the most unexpected developments in the 2020 presidential campaign is how remarkably stable the state of the race has proved to be through extraordinarily turbulent times. As the race for the White House comes to a close, the landscape looks quite similar to how it looked after the party conventions in August as the fall campaign got underway."
Use this map as a starting point to create and share your own 2020 presidential election forecast.
November 2 : Arizona moves from Leans Democratic to Toss-up.
NPR 2020 Election Map Ratings
The final 2020 electoral college projection from NPR.
Use this map as a starting point to create and share your own 2020 electoral map forecast.
October 30: Four changes. Note that NPR is using the 'Likely' terminology to cover what others call both 'Likely' and 'Safe'. We label those states safe on this map as, for the most part, this is consistent with how these states are characterized in other forecasts.

