South Carolina 2020 Presidential Election Polls
Biden vs. Trump
| Source | Date | Sample | Biden | Trump | Other | |
|---|---|---|---|---|---|---|
| Poll Averages† | 43.3% | 50.3% | - | |||
| Morning Consult | 11/02/2020 | 904 LV ±3% | 45% | 51% | 4% | |
| East Carolina Univ. | 10/28/2020 | 763 LV ±4.1% | 44% | 51% | 5% | |
| Morning Consult | 10/22/2020 | 926 LV ±3.2% | 45% | 51% | 4% | |
| NY Times / Siena College | 10/15/2020 | 605 LV ±4.5% | 41% | 49% | 10% | |
| Morning Consult | 10/13/2020 | 903 LV ±3.3% | 42% | 54% | 4% | |
| Quinnipiac | 9/30/2020 | 1,123 LV ±2.9% | 47% | 48% | 5% | |
| YouGov/CBS News | 9/27/2020 | 1,065 LV ±3.8% | 42% | 52% | 6% | |
| Morning Consult | 9/22/2020 | 764 LV ±4% | 44% | 50% | 6% | |
| Quinnipiac | 9/16/2020 | 969 LV ±3.2% | 45% | 51% | 4% | |
| Quinnipiac | 8/06/2020 | 914 RV ±3.2% | 42% | 47% | 11% | |
Show:
†The average includes the most recent poll from each source within the past 30 days, up to a maximum of five. If five polls are found, and there are other qualifying polls on that same calendar date, those will also be included.
Including Third Parties
Calculated averages are not comparable to those for the Biden vs. Trump polls. As polling with third parties has been very limited, the polls included in the average are often different.
| Source | Date | Sample | Biden | Trump | Jorgensen | Hawkins | Other | |
|---|---|---|---|---|---|---|---|---|
| NY Times / Siena College | 10/15/2020 | 605 LV ±4.5% | 41% | 49% | 2% | 1% | 7% | |
†The average includes the most recent poll from each source within the past 30 days, up to a maximum of five. If five polls are found, and there are other qualifying polls on that same calendar date, those will also be included.
When did it last happen?
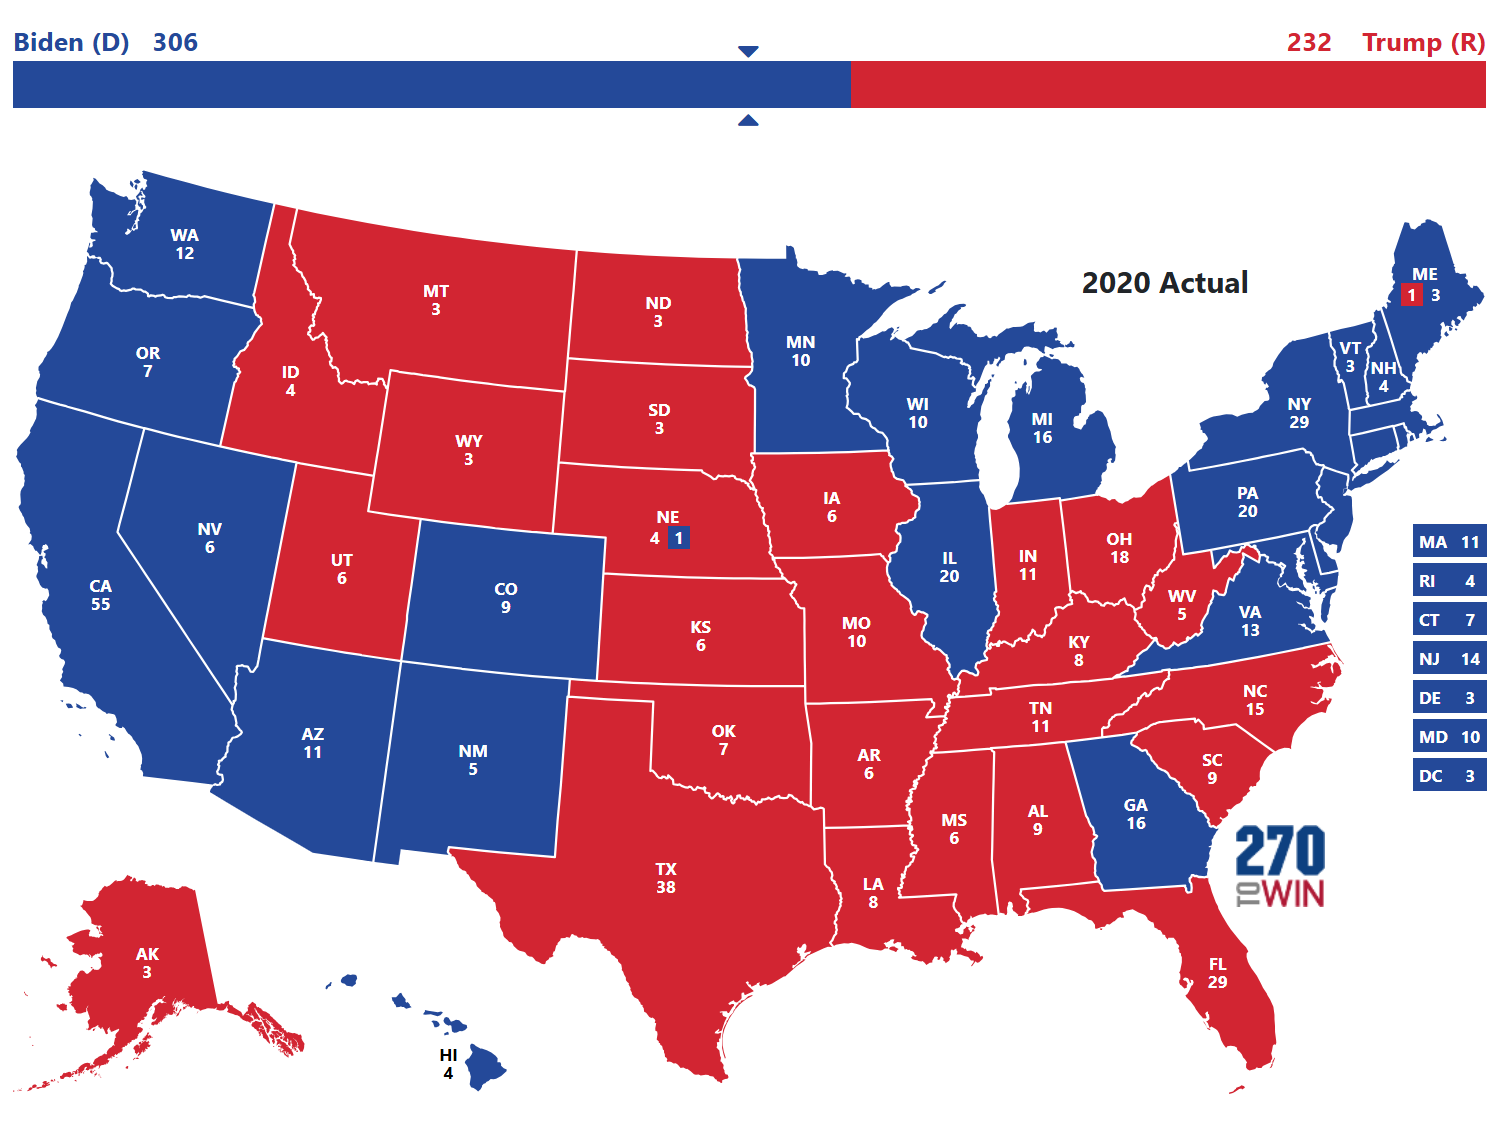
This feature shows the most recent election where the state voted with or against the presidential winner in each party. Click the year to see the corresponding electoral map and results.South Carolina Winner
Trump
Trump
Carter
Stevenson
Election Winner
Biden
Trump
Carter
Eisenhower
2020
2016
1976
1956