New Interactive: U.S. House State View
By 270toWin Staff
August 13, 2020
Update (August 19): Since most saved maps have a limited number of toss-ups, we've expanded the State View to allow for the adjustment of districts that have been set to Leans Democratic or Republican. This will provide more flexibility for what-if scenarios across the range of the more competitive districts.
The text below has been adjusted to reflect this change.
===
We've added a 'State View' feature to the 2020 Interactive House Map. For any saved map - either one of our forecast maps or a map you create - click or tap the 'State View' button to view the partisan breakdown by party in each state. The associated map is colored to reflect the majority delegation in each state, based on the forecast.
For example, here's the majority map based on the current Consensus Forecast:
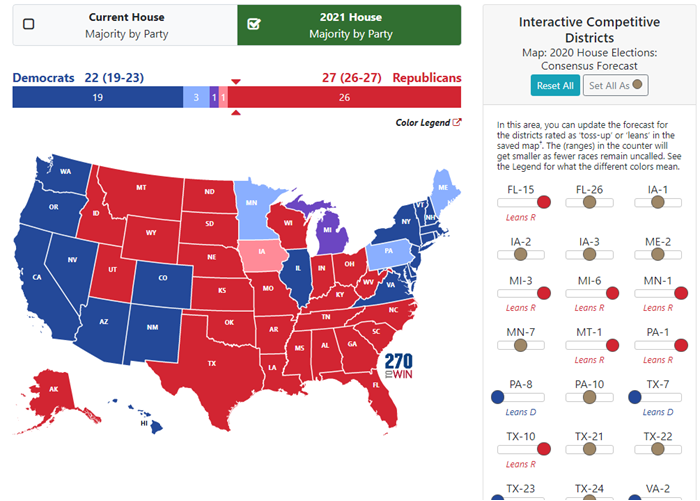
To the right (below on a small screen) of the map is the 'Interactive Competitive Districts' table. This is a partial list of the most competitive districts, those set as toss-up or leaning Democratic/Republican in the associated forecast. This display is limited to those districts in states where, depending on how they resolved, the majority party could still change.
Use this area to game out different scenarios.
Districts set as 'Leans' start out associated with the party to which they lean. You can change those individually, or use the 'Set All As Toss-up' button to see the widest possible range based on these competitive districts.
The counter above the map shows the number of states where each party has the majority. The darker red/blue is where the majority has been decided (based on the forecast map and choices made in the table), while the lighter shades indicate those states where a party is ahead, but may not be after remaining toss-ups are resolved. The numbers in parentheses reflect the range of possible outcomes.
Prior to the 2018 midterms, the GOP had the majority in 32 states, Democrats 17, with one tie. The split was much closer, 26-22-2 in favor of Republicans, after that election. With Justin Amash's departure from the GOP in 2019, the current split is 26-23, with one tie. Click or tap the 'Current House' button to see that distribution; the state-by-state totals are in the table below the map.
At this point, despite a decent number of toss-ups - there are 24 in the Consensus Forecast - it doesn't look like there will be much change in the current partisan split after the upcoming election.
One area where this is particularly relevant is in the event of an electoral college tie. In that case, the next president will be chosen by the U.S. House of Representatives. It is the 117th Congress, seated in early January, 2021, that will cast those votes. Each state receives one vote, regardless of the number of districts it has. A majority - 26 votes - is needed to win.

