Eight Weeks Out: State of the Presidential Race
By 270toWin Staff
September 13, 2016
It is exactly 8 weeks until the 2016 presidential election. Here are two views of the electoral map as of today. Select either of the maps to use as a starting point to create and share your own forecast.
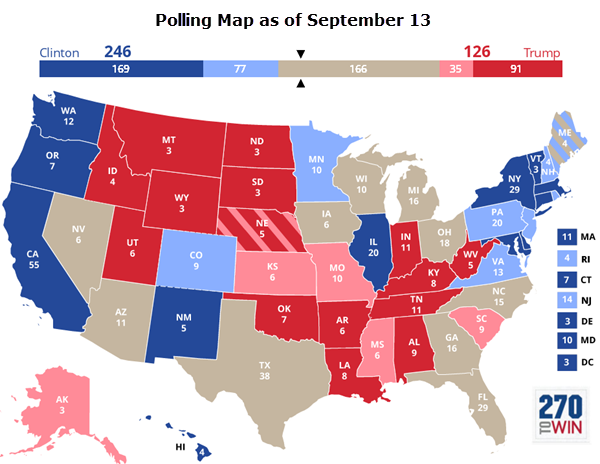
Polling Map
This map takes a look at the electoral map entirely based on state-level polls. We try and base it on a polling average (vs. a single poll), wherever possible. Since polls are a snapshot in time, this map more closely answers the "If the election were today...." question. It also means the map is subject to significant change between now and Election Day, particularly in states where polling has been very limited to this point.
The national polls have tightened recently, and this has begun to show up in the state-level polling, with many states now in the toss-up category. For this map that is defined as a spread of five points or less. As of now, the closest states in the polling averages are Iowa, Arizona and Florida; these are tied.
Consensus Pundit Electoral Map
This map aggregates the electoral map forecast from nine different organizations into a single map. These are all projections for November. Forecasters consider polling, history, demographics and other variables to come up with their projections. As a result, this map doesn't change as frequently. This morning's update showed no change from the last time we looked at it in late August. Clinton leads 273-175, with 90 electoral votes, from six states, seen as true toss-ups.
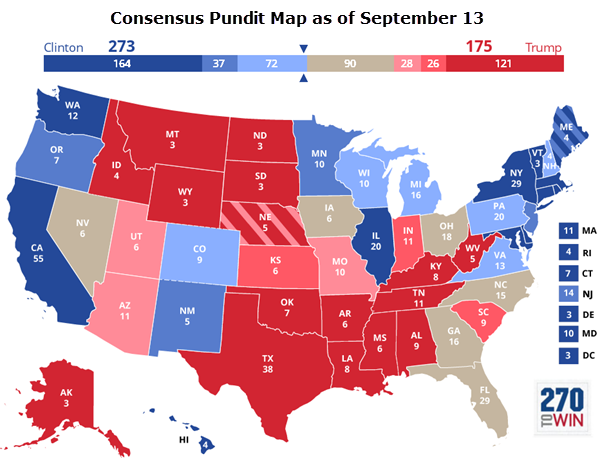
As the election nears, these two maps should converge on a pretty similar outlook.

