Using the Interactive Electoral Map: Features and Tips
The location for some of these features may vary based on the width of your screen display.
Color Palette: More colors let you to create more granular forecasts. Use the -/+ buttons to add or remove colors. You can choose 3 (safe, toss-up); 5 (safe, leaning, toss-up), 7 (safe, likely, leaning, toss-up) or 9 (safe, likely, leaning, tilt, toss-up) colors. There's also an option to rotate in a 3rd party candidate.
Creating a Forecast: Choose an option from the 'Map Library' (you will need to click 'Reset Map' if you are viewing a User-Created Map) or simply select any state to begin creating your personal 2020 election forecast. States will rotate between the active colors in the color palette unless you specify a specific color. The electoral counter above the map will adjust as you go along. The arrows adjacent to the counter will turn blue or red if either party/candidate has reached 270 electoral votes.
Model, Polling and Analyst Forecasts: Visit the forecaster page for a wide variety of qualitative and quantitative 2020 projections. Select any of them for full details; you can modify these maps as per the above to create your own forecast. See 'Timelines' below for an additional feature associated with some of these maps.
Candidate Names: You can replace Democrat vs. Republican with Biden vs. Trump (and vice-versa) by selecting the down arrow near the total electoral votes for each party. Earlier in a cycle, the drop down box will include the then-active declared candidates for each party's nomination.
Share: Let people see your 2020 forecast by selecting the Share Map button. You can then share the map via social media or email.
Embed: Display your map on any web page. Select Share Map and then choose the Embed button.
Save: If you are working on the home page (no map id in the URL), and cookies are enabled on your device, your map should be as you leave it the next time you return to that page. Another option is to select the Share Map button, which will create a permanent URL of your map at that point in time.
Split Maine and Nebraska: These two states use a different method of awarding electoral votes. Use the Split Votes area to divide up electoral votes between the candidates.
Road to 270: This feature appears below the interactive map. When 12 or fewer states remain undecided and neither party has 270 electoral votes, it will calculate the number of critical path combinations that remain, updating as you change your forecast. Any 'Must Win' and 'Not Needed' states will also be calculated. There's also an option to view each individual combination.
Timelines: Some 270toWin-created forecast maps offer a historical daily or weekly timeline, allowing you to view changes to the map's ratings over time. Where is a timeline, only the 'Current' map is interactive.
You can control the timeline manually by selecting the < or > buttons. You can also drag the timeline with your mouse or finger on a touch device.
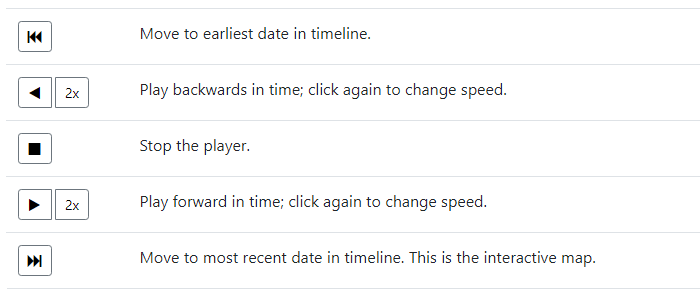
There's also a series of Player Controls that will auto-play through the map history.
Past Elections: If you want to review presidential election history, start at our historical elections page or see them all on one page with the historical timeline. If you'd like to change the past, we now have interactive historical presidential election maps.

