2018 New York House Election Interactive Map
All US House seats to be contested in 2018
New York has 27 congressional districts, tied with Florida for 3rd most in the U.S. Democrats hold 18 of these seats - including one vacancy - many of which are in or adjacent to New York City. The nine smallest districts in the nation, by land area, are all located in four boroughs of New York City. The smallest of these, NY-13, is just over 10 square miles. Interestingly, the 18 smallest districts in the nation are all represented by Democrats. The smallest to be Republican-held is NY-11, which covers all of the final NYC borough, Staten Island, as well as a small part of southern Brooklyn.
NY-25 is vacant after the death of Louise Slaughter while Rep. Joe Crowley (NY-14) lost his primary. Both those seats are safely Democratic. The remaining 25 incumbents are seeking reelection in 2018.
To create your own forecast for the midterms, visit the 2018 House Interactive Map.

Hover over a district for details.
| District | Incumbent | Party | Since | Term | Predictions | Margin of Victory | ||||||||||||||||||||||||||||||||||||||||||||||||||||||||||||||||||||||||||||||||||||||||||||
|---|---|---|---|---|---|---|---|---|---|---|---|---|---|---|---|---|---|---|---|---|---|---|---|---|---|---|---|---|---|---|---|---|---|---|---|---|---|---|---|---|---|---|---|---|---|---|---|---|---|---|---|---|---|---|---|---|---|---|---|---|---|---|---|---|---|---|---|---|---|---|---|---|---|---|---|---|---|---|---|---|---|---|---|---|---|---|---|---|---|---|---|---|---|---|---|---|---|---|
| Pro | Map | House(a) | President(b) | |||||||||||||||||||||||||||||||||||||||||||||||||||||||||||||||||||||||||||||||||||||||||||||||
| NY-1 | 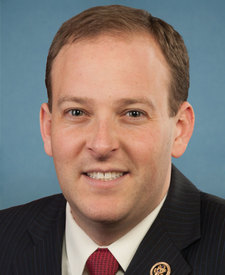 |
Lee Zeldin | 2015 | 2nd |
|
17.9% | 12.3% | |||||||||||||||||||||||||||||||||||||||||||||||||||||||||||||||||||||||||||||||||||||||||||
| NY-2 | 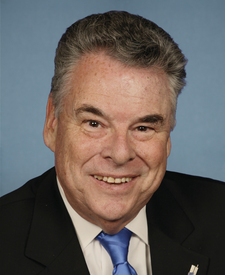 |
Peter King | 1993 | 13th |
|
24.9% | 9.1% | |||||||||||||||||||||||||||||||||||||||||||||||||||||||||||||||||||||||||||||||||||||||||||
| NY-11 | 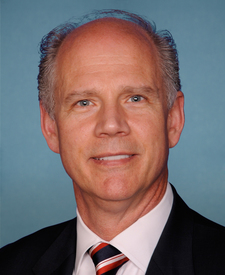 |
Daniel Donovan | 2015 | 2nd |
|
24.9% | 9.8% | |||||||||||||||||||||||||||||||||||||||||||||||||||||||||||||||||||||||||||||||||||||||||||
| NY-18 | 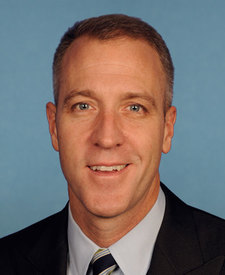 |
Sean P. Maloney | 2013 | 3rd |
|
11.2% | 1.9% | |||||||||||||||||||||||||||||||||||||||||||||||||||||||||||||||||||||||||||||||||||||||||||
| NY-19 | 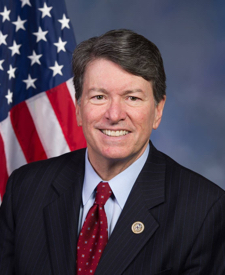 |
John Faso | 2017 | 1st |
|
8.6% | 6.8% | |||||||||||||||||||||||||||||||||||||||||||||||||||||||||||||||||||||||||||||||||||||||||||
| NY-21 | 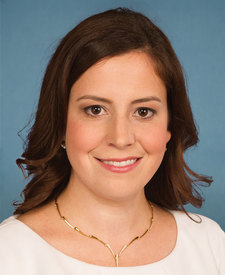 |
Elise Stefanik | 2015 | 2nd |
|
35.1% | 13.9% | |||||||||||||||||||||||||||||||||||||||||||||||||||||||||||||||||||||||||||||||||||||||||||
| NY-22 | 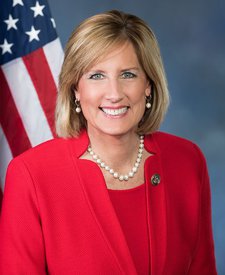 |
Claudia Tenney | 2017 | 1st |
|
5.5% | 15.5% | |||||||||||||||||||||||||||||||||||||||||||||||||||||||||||||||||||||||||||||||||||||||||||
| NY-23 | 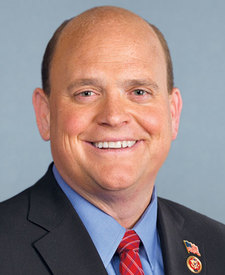 |
Tom Reed | 2010 | 5th |
|
15.2% | 14.8% | |||||||||||||||||||||||||||||||||||||||||||||||||||||||||||||||||||||||||||||||||||||||||||
| NY-24 | 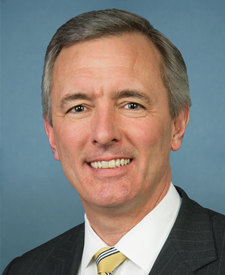 |
John Katko | 2015 | 2nd |
|
21.1% | 3.6% | |||||||||||||||||||||||||||||||||||||||||||||||||||||||||||||||||||||||||||||||||||||||||||
| NY-27 | 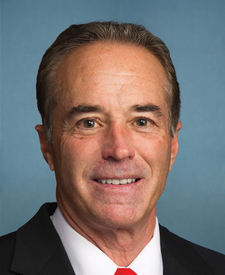 |
Chris Collins | 2013 | 3rd |
|
34.4% | 24.5% | |||||||||||||||||||||||||||||||||||||||||||||||||||||||||||||||||||||||||||||||||||||||||||
| NY-3 | 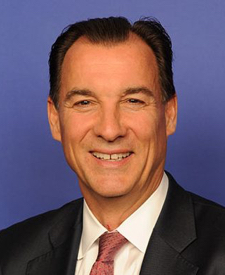 |
Thomas Suozzi | 2017 | 1st |
|
5.6% | 6.1% | |||||||||||||||||||||||||||||||||||||||||||||||||||||||||||||||||||||||||||||||||||||||||||
| NY-4 | 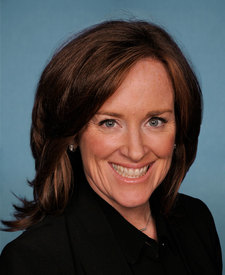 |
Kathleen Rice | 2015 | 2nd |
|
19.1% | 9.6% | |||||||||||||||||||||||||||||||||||||||||||||||||||||||||||||||||||||||||||||||||||||||||||
| NY-5 | 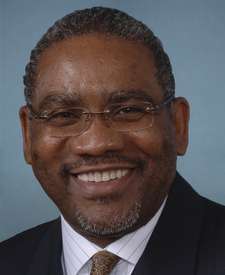 |
Gregory Meeks | 1998 | 11th |
|
72.5% | 73.0% | |||||||||||||||||||||||||||||||||||||||||||||||||||||||||||||||||||||||||||||||||||||||||||
| NY-6 | 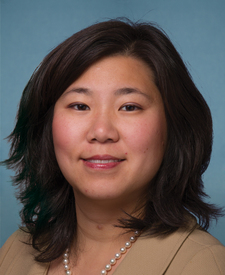 |
Grace Meng | 2013 | 3rd |
|
45.4% | 33.0% | |||||||||||||||||||||||||||||||||||||||||||||||||||||||||||||||||||||||||||||||||||||||||||
| NY-7 | 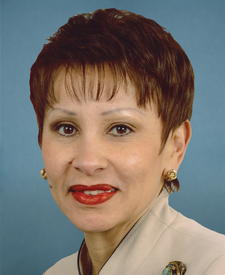 |
Nydia Velazquez | 1993 | 13th |
|
81.6% | 76.5% | |||||||||||||||||||||||||||||||||||||||||||||||||||||||||||||||||||||||||||||||||||||||||||
| NY-8 | 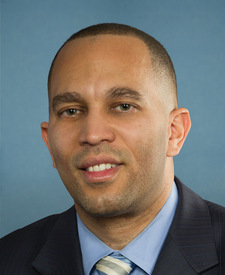 |
Hakeem Jeffries | 2013 | 3rd |
|
86.6% | 71.1% | |||||||||||||||||||||||||||||||||||||||||||||||||||||||||||||||||||||||||||||||||||||||||||
| NY-9 | 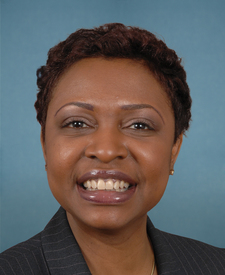 |
Yvette Clarke | 2007 | 6th |
|
84.8% | 69.1% | |||||||||||||||||||||||||||||||||||||||||||||||||||||||||||||||||||||||||||||||||||||||||||
| NY-10 | 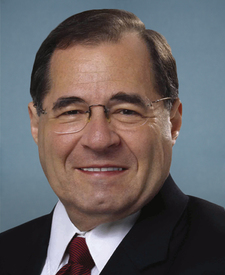 |
Jerrold Nadler | 1992 | 14th |
|
56.2% | 59.5% | |||||||||||||||||||||||||||||||||||||||||||||||||||||||||||||||||||||||||||||||||||||||||||
| NY-12 | 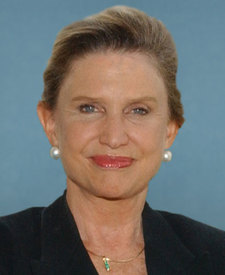 |
Carolyn Maloney | 1993 | 13th |
|
66.4% | 69.8% | |||||||||||||||||||||||||||||||||||||||||||||||||||||||||||||||||||||||||||||||||||||||||||
| NY-13 | 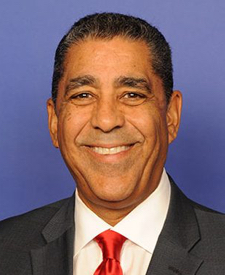 |
Adriano Espaillat | 2017 | 1st |
|
81.9% | 86.9% | |||||||||||||||||||||||||||||||||||||||||||||||||||||||||||||||||||||||||||||||||||||||||||
| NY-14 | 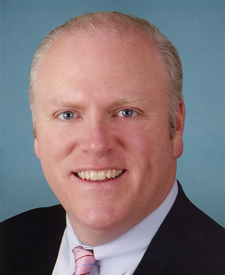 |
Joseph Crowley | 1999 | 10th |
|
65.7% | 57.9% | |||||||||||||||||||||||||||||||||||||||||||||||||||||||||||||||||||||||||||||||||||||||||||
|
Incumbent defeated in primary for 2018 election.
|
||||||||||||||||||||||||||||||||||||||||||||||||||||||||||||||||||||||||||||||||||||||||||||||||||
| NY-15 | 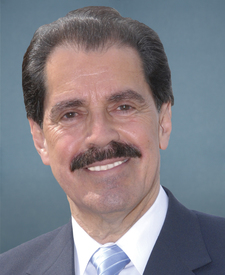 |
Jose Serrano | 1990 | 15th |
|
91.7% | 88.9% | |||||||||||||||||||||||||||||||||||||||||||||||||||||||||||||||||||||||||||||||||||||||||||
| NY-16 | 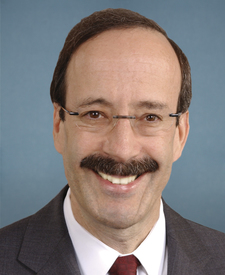 |
Eliot Engel | 1989 | 15th |
|
89.3% | 52.6% | |||||||||||||||||||||||||||||||||||||||||||||||||||||||||||||||||||||||||||||||||||||||||||
| NY-17 | 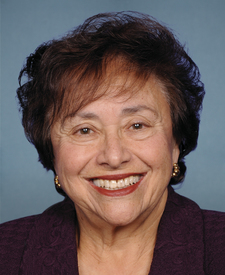 |
Nita Lowey | 1989 | 15th |
|
* | 20.2% | |||||||||||||||||||||||||||||||||||||||||||||||||||||||||||||||||||||||||||||||||||||||||||
| NY-20 |  |
Paul Tonko | 2009 | 5th |
|
35.8% | 13.5% | |||||||||||||||||||||||||||||||||||||||||||||||||||||||||||||||||||||||||||||||||||||||||||
| NY-25 |  |
Joe Morelle | 2018 | 1st |
|
12.4% | 16.4% | |||||||||||||||||||||||||||||||||||||||||||||||||||||||||||||||||||||||||||||||||||||||||||
| NY-26 |  |
Brian Higgins | 2005 | 7th |
|
49.2% | 19.6% | |||||||||||||||||||||||||||||||||||||||||||||||||||||||||||||||||||||||||||||||||||||||||||
(a)Source: Ballotpedia (for margins). The margin is the percentage difference between the top two vote-getters in 2016.
More recent results (i.e., special elections held in 2017-18 for vacancies) are not displayed.
* Race was uncontested | ^Top two vote-getters were from the same party
(b)Source: Daily Kos. The margin is the percentage difference between Donald Trump and Hillary Clinton.

