2018 Alabama House Election Interactive Map
All US House seats to be contested in 2018
Alabama has seven congressional districts, six of which are held by Republicans. All incumbents are running in 2018 and all these seats look to be safe for the controlling party.
To create your own forecast for the midterms, visit the 2018 House Interactive Map.

Hover over a district for details.
| District | Incumbent | Party | Since | Term | Predictions | Margin of Victory | ||||||||||||||||||||||||||||||||||||||||||||||||||||||||||||||||||||||||||||||||||||||||||||
|---|---|---|---|---|---|---|---|---|---|---|---|---|---|---|---|---|---|---|---|---|---|---|---|---|---|---|---|---|---|---|---|---|---|---|---|---|---|---|---|---|---|---|---|---|---|---|---|---|---|---|---|---|---|---|---|---|---|---|---|---|---|---|---|---|---|---|---|---|---|---|---|---|---|---|---|---|---|---|---|---|---|---|---|---|---|---|---|---|---|---|---|---|---|---|---|---|---|---|
| Pro | Map | House(a) | President(b) | |||||||||||||||||||||||||||||||||||||||||||||||||||||||||||||||||||||||||||||||||||||||||||||||
| AL-1 | 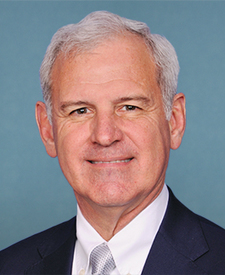 |
Bradley Byrne | 2014 | 3rd |
|
* | 29.4% | |||||||||||||||||||||||||||||||||||||||||||||||||||||||||||||||||||||||||||||||||||||||||||
| AL-2 | 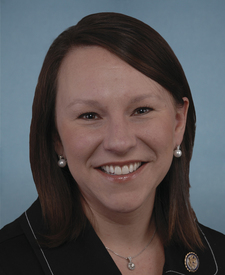 |
Martha Roby | 2011 | 4th |
|
8.2% | 31.9% | |||||||||||||||||||||||||||||||||||||||||||||||||||||||||||||||||||||||||||||||||||||||||||
| AL-3 | 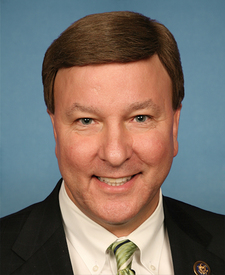 |
Mike Rogers | 2003 | 8th |
|
34.0% | 33.0% | |||||||||||||||||||||||||||||||||||||||||||||||||||||||||||||||||||||||||||||||||||||||||||
| AL-4 |  |
Robert Aderholt | 1997 | 11th |
|
* | 63.0% | |||||||||||||||||||||||||||||||||||||||||||||||||||||||||||||||||||||||||||||||||||||||||||
| AL-5 | 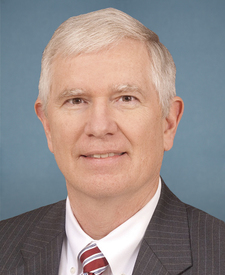 |
Mo Brooks | 2011 | 4th |
|
33.5% | 33.4% | |||||||||||||||||||||||||||||||||||||||||||||||||||||||||||||||||||||||||||||||||||||||||||
| AL-6 |  |
Gary Palmer | 2015 | 2nd |
|
49.1% | 44.7% | |||||||||||||||||||||||||||||||||||||||||||||||||||||||||||||||||||||||||||||||||||||||||||
| AL-7 | 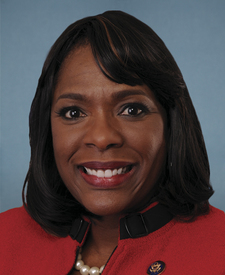 |
Terri Sewell | 2011 | 4th |
|
* | 41.2% | |||||||||||||||||||||||||||||||||||||||||||||||||||||||||||||||||||||||||||||||||||||||||||
(a)Source: Ballotpedia (for margins). The margin is the percentage difference between the top two vote-getters in 2016.
More recent results (i.e., special elections held in 2017-18 for vacancies) are not displayed.
* Race was uncontested | ^Top two vote-getters were from the same party
(b)Source: Daily Kos. The margin is the percentage difference between Donald Trump and Hillary Clinton.

