Introducing the 2020 Democratic Delegate Calculator
By 270toWin Staff
December 7, 2019
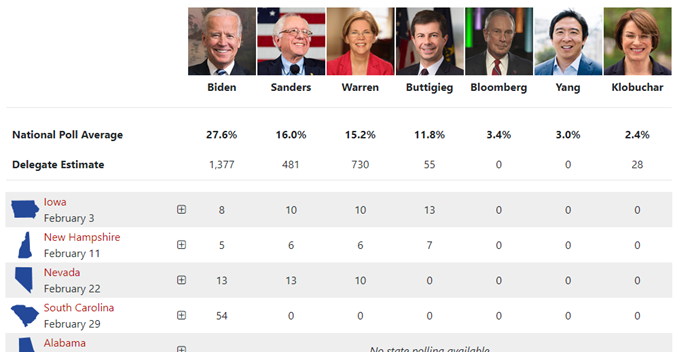
The road to an uncontested Democratic nomination requires a candidate to earn 1,990 pledged delegates1 and begins in Iowa on February 3. To that end, the first version of our 2020 Democratic Delegate Calculator is now available. It is based on available statewide polling. An interactive version, where you can create your own forecast, will be available in the near future.
As we launch, the display shows all candidates projected to earn delegates based on polling, as well as anyone with a national polling average higher than that of the lowest delegate-qualifying candidate. As of now, five candidates would earn delegates based on polling: Biden, Warren, Sanders, Buttigieg and Klobuchar. Also displayed are Bloomberg and Yang, who have a higher national polling average than Klobuchar.
Unlike the GOP, the Democratic Party allocates pledged delegates the same way in each state. It is a proportional allocation, with a 15% minimum to qualify for any delegates. However, within each state, delegates are split into groups. There is some variety, but in most states this means some delegates are allocated based on the statewide vote, with the remainder based on the vote within each congressional district. The 15% threshold is applied to each location, meaning a candidate who gets less than 15% statewide could still earn some delegates.
Several important caveats here:
- Due to the Thanksgiving holiday - and probably the holiday season in general - there hasn't been all that much recent state polling released. Until that catches up, this page may lag the true state of the delegate race.
- As noted above, statewide polling - which is all we have to work with - is unlikely to mirror the vote within each district. That means even if the polling average we've calculated ends up being exactly right, the actual delegate allocation could be somewhat different.
- While the overall number of pledged delegates for each state is known, the numeric distribution by groups is not final. As those become better understood, the calculation for each state could change slightly, even if the polling doesn't. You can click/tap the '+' in each state row to see the estimated breakdown.
- The primaries and caucuses take place over a four-month period, with each contest influenced by the ones before it. Candidates will gain/lose momentum, and many will drop out. The point is that polling today may in no way reflect the race closer to a state's primary. The interactive version we are building will give you the option to predict a dropout date for each candidate as a way to somewhat model this dynamic.
1 This number might still change slightly.

