Introducing the 2020 House Interactive Map
By 270toWin Staff
January 24, 2019
The 2020 House Interactive Map is now live. Use it to create and share your forecast for the 2020 House elections.
In the table below the interactive map, view the incumbent for each seat, along with their margin of victory in 2018. Compare that to the margins in the 2016 presidential election between Donald Trump and Hillary Clinton.
The table defaults to all races seen as competitive in 2020, based on initial ratings by Sabato's Crystal Ball. As you pan/zoom on the map, the table will update to show all seats visible in the map area. To view all districts in a specific state, choose it in the drop-down menu below the seat counter.
Democrats gained 40 seats in the 2018 midterms, and now hold 235 seats to 198 for the Republicans. There are two vacancies in previously GOP-held seats: PA-12 and NC-9. There will be a special election in PA-12 on May 21, coinciding with the state's primary election. It is unclear when the North Carolina vacancy will be filled.
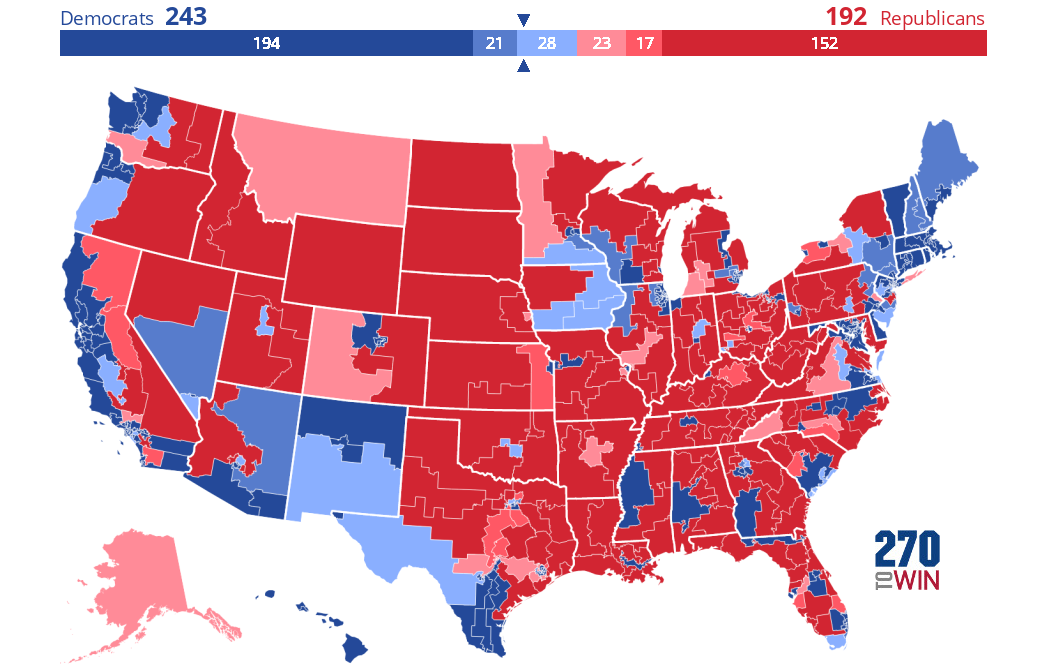
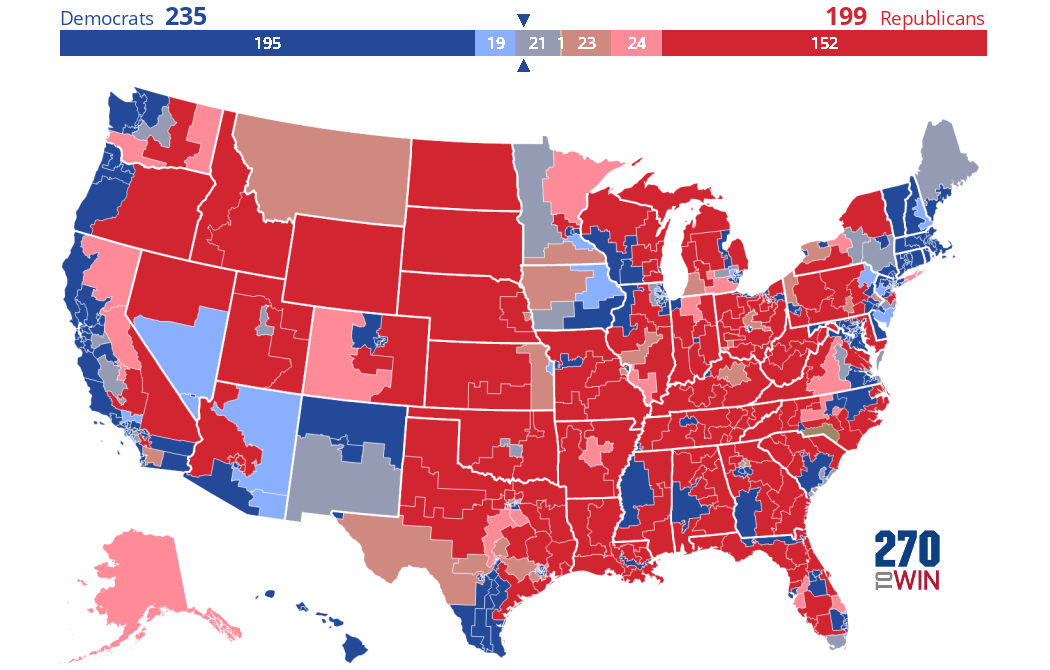
The House map arrives with three Starting Views. In addition to a blank map, there is the initial 2020 forecast from Sabato's Crystal Ball and a map that shows the most competitive races in 2018, based on margin of victory. Click or tap the images below for an interactive version of these.
Sabato's Crystal Ball
"Democrats start the cycle favored to hold the House majority, but a GOP presidential victory would open the door to Republicans restoring total control of Washington." Read their full analysis >>
This map separates the 87* races decided by 10% or less in 2018. Those decided by less than 5% are shown as a tilt rating, while the elections with 5-10% margins are shown as a leans rating. The remainder are displayed as safe.


