How Trump's Approval Rating Looks on the Electoral Map
By 270toWin Staff
January 30, 2018
Gallup has published Donald Trump's approval rating in each of the 50 states. This is based on over 170,000 interviews conducted during 2017. Trump's national approval rating averaged 38% during 2017, with 56% disapproving. Breaking it down by state, the results ranged from 26% in Vermont to 61% in West Virginia. (Washington D.C. gave Trump an approval rating of 6%).
Gallup found that Trump had approval ratings above his 38% national average in 33 of the 50 states. This occurred because some of the states where he performs most poorly are very populous states like California. At a high level, this outcome sounds pretty similar to what we saw in the 2016 election, where Trump surpassed 270 electoral votes while losing the popular vote.
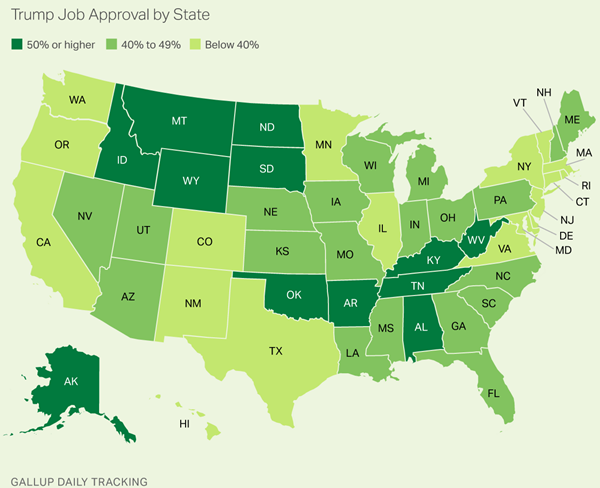
Texas appears to be the biggest surprise; Trump's approval here was just 39%. A couple caveats to keep in mind: the surveys were taken over the course of an entire year, so not really a snapshot in time. Also, the surveys were of adults; no consideration given to voter registration status. That last point might help explain the low number in Texas, as Latinos have historically voted at lower rates than whites.
The above in mind, it probably isn't totally fair to try and translate approval ratings into a 2020 electoral map. Of course, if one published a website around electoral maps, they might do it anyway. So here it is. The map is interactive, so if you don't agree with our categorizations (below the map), you can change them and create your own.
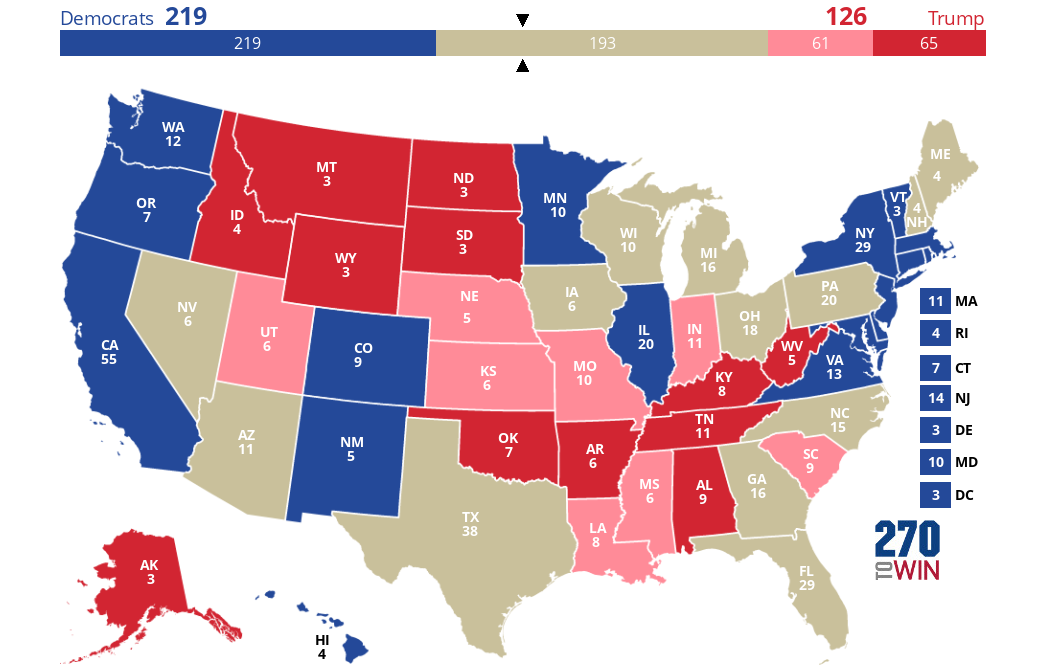
 Click the map to create your own at
 - All states with Trump at 50% or higher shown as red.
- All states, except Texas, with Trump below 40% shown as Democratic. As it turns out, this is all the states Clinton won in 2016 except for Maine, New Hampshire and Nevada.
- Texas is shown as undecided/toss-up based on the above discussion.
- All states in the 40-49% range are shown as undecided/toss-up unless Clinton or Trump won it by more than 10% in 2016. There are eight states won by Trump that fit in this category; they are shown as pink in the map.
- District information is not provided for Maine or Nebraska, so the map ignores any split possibilities.

