2018 Ohio House Election Interactive Map
All US House seats to be contested in 2018
Ohio has 16 congressional districts. Republicans hold 12 of them, Democrats four.
As the political climate has continued to shift, several of the Republican-held seats have moved from 'safe' to more competitive. These are all in districts Republicans won by 18 points or more in 2016.
To create your own forecast for the midterms, visit the 2018 House Interactive Map.

Hover over a district for details.
| District | Incumbent | Party | Since | Term | Predictions | Margin of Victory | ||||||||||||||||||||||||||||||||||||||||||||||||||||||||||||||||||||||||||||||||||||||||||||
|---|---|---|---|---|---|---|---|---|---|---|---|---|---|---|---|---|---|---|---|---|---|---|---|---|---|---|---|---|---|---|---|---|---|---|---|---|---|---|---|---|---|---|---|---|---|---|---|---|---|---|---|---|---|---|---|---|---|---|---|---|---|---|---|---|---|---|---|---|---|---|---|---|---|---|---|---|---|---|---|---|---|---|---|---|---|---|---|---|---|---|---|---|---|---|---|---|---|---|
| Pro | Map | House(a) | President(b) | |||||||||||||||||||||||||||||||||||||||||||||||||||||||||||||||||||||||||||||||||||||||||||||||
| OH-1 | 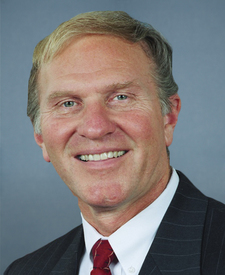 |
Steve Chabot | 2011 | 4th |
|
18.4% | 6.6% | |||||||||||||||||||||||||||||||||||||||||||||||||||||||||||||||||||||||||||||||||||||||||||
| OH-7 | 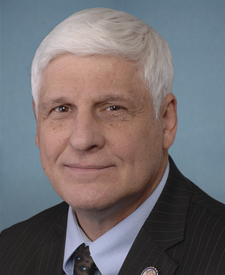 |
Bob Gibbs | 2011 | 4th |
|
35.1% | 29.7% | |||||||||||||||||||||||||||||||||||||||||||||||||||||||||||||||||||||||||||||||||||||||||||
| OH-10 | 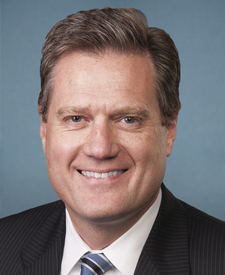 |
Michael Turner | 2003 | 8th |
|
31.4% | 7.3% | |||||||||||||||||||||||||||||||||||||||||||||||||||||||||||||||||||||||||||||||||||||||||||
| OH-12 | 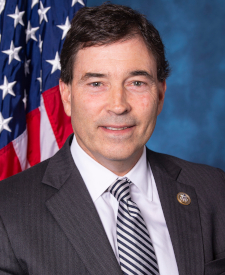 |
Troy Balderson | 2018 | 1st |
|
36.7% | 11.3% | |||||||||||||||||||||||||||||||||||||||||||||||||||||||||||||||||||||||||||||||||||||||||||
| OH-14 | 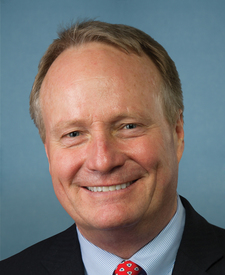 |
David Joyce | 2013 | 3rd |
|
25.2% | 11.5% | |||||||||||||||||||||||||||||||||||||||||||||||||||||||||||||||||||||||||||||||||||||||||||
| OH-15 | 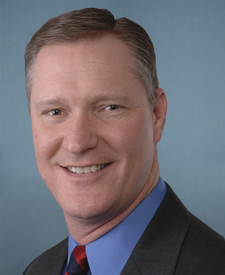 |
Steve Stivers | 2011 | 4th |
|
32.3% | 15.4% | |||||||||||||||||||||||||||||||||||||||||||||||||||||||||||||||||||||||||||||||||||||||||||
| OH-2 | 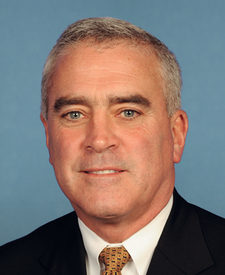 |
Brad Wenstrup | 2013 | 3rd |
|
32.2% | 16.1% | |||||||||||||||||||||||||||||||||||||||||||||||||||||||||||||||||||||||||||||||||||||||||||
| OH-3 | 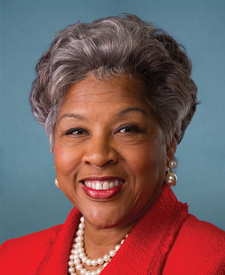 |
Joyce Beatty | 2013 | 3rd |
|
37.1% | 38.4% | |||||||||||||||||||||||||||||||||||||||||||||||||||||||||||||||||||||||||||||||||||||||||||
| OH-4 | 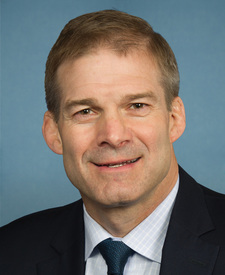 |
Jim Jordan | 2007 | 6th |
|
36.0% | 33.6% | |||||||||||||||||||||||||||||||||||||||||||||||||||||||||||||||||||||||||||||||||||||||||||
| OH-5 | 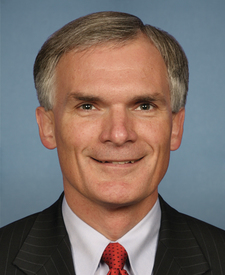 |
Robert Latta | 2007 | 6th |
|
41.8% | 25.1% | |||||||||||||||||||||||||||||||||||||||||||||||||||||||||||||||||||||||||||||||||||||||||||
| OH-6 |  |
Bill Johnson | 2011 | 4th |
|
41.4% | 42.6% | |||||||||||||||||||||||||||||||||||||||||||||||||||||||||||||||||||||||||||||||||||||||||||
| OH-8 | 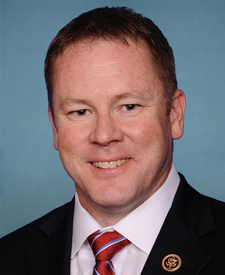 |
Warren Davidson | 2016 | 2nd |
|
41.8% | 34.5% | |||||||||||||||||||||||||||||||||||||||||||||||||||||||||||||||||||||||||||||||||||||||||||
| OH-9 | 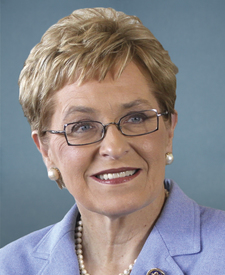 |
Marcy Kaptur | 1983 | 18th |
|
37.4% | 22.2% | |||||||||||||||||||||||||||||||||||||||||||||||||||||||||||||||||||||||||||||||||||||||||||
| OH-11 | 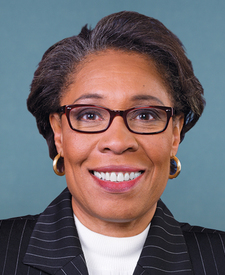 |
Marcia Fudge | 2008 | 6th |
|
60.5% | 63.5% | |||||||||||||||||||||||||||||||||||||||||||||||||||||||||||||||||||||||||||||||||||||||||||
| OH-13 | 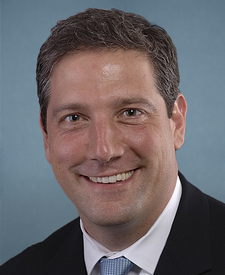 |
Tim Ryan | 2003 | 8th |
|
35.5% | 6.5% | |||||||||||||||||||||||||||||||||||||||||||||||||||||||||||||||||||||||||||||||||||||||||||
| OH-16 | 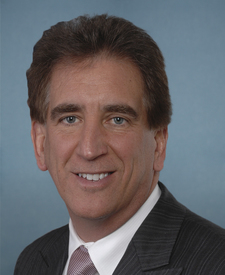 |
Jim Renacci | 2011 | 4th |
|
30.7% | 16.6% | |||||||||||||||||||||||||||||||||||||||||||||||||||||||||||||||||||||||||||||||||||||||||||
|
Incumbent not running for re-election in 2018.
|
||||||||||||||||||||||||||||||||||||||||||||||||||||||||||||||||||||||||||||||||||||||||||||||||||
(a)Source: Ballotpedia (for margins). The margin is the percentage difference between the top two vote-getters in 2016.
More recent results (i.e., special elections held in 2017-18 for vacancies) are not displayed.
* Race was uncontested | ^Top two vote-getters were from the same party
(b)Source: Daily Kos. The margin is the percentage difference between Donald Trump and Hillary Clinton.

