Interactive Maps for FiveThirtyEight 2022 Election Forecast
By 270toWin Staff
July 5, 2022, 1:34 PM ET
FiveThirtyEight has recently published its 2022 election forecasts for Senate, House, and governor. We've created interactive maps for each. You can use these as a starting point to create and share your own 2022 predictions.
For more background, see the 'Model Talk' podcast (watch or listen) from June 30. You can also read the model methodology.
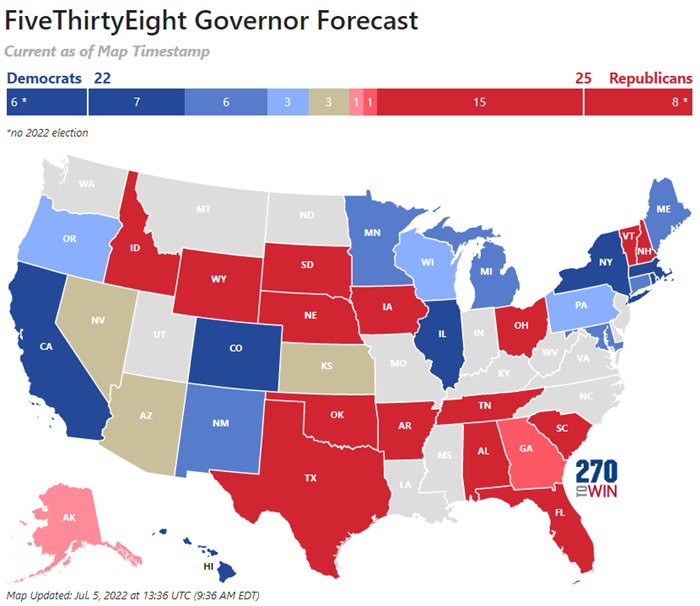
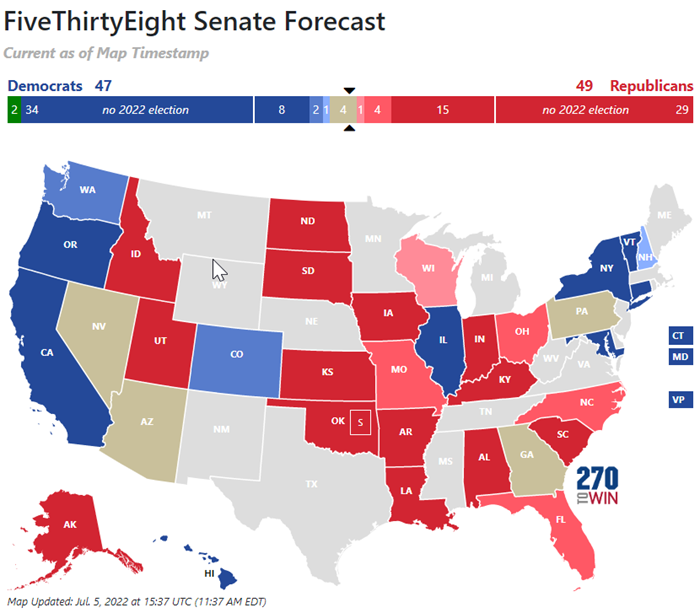
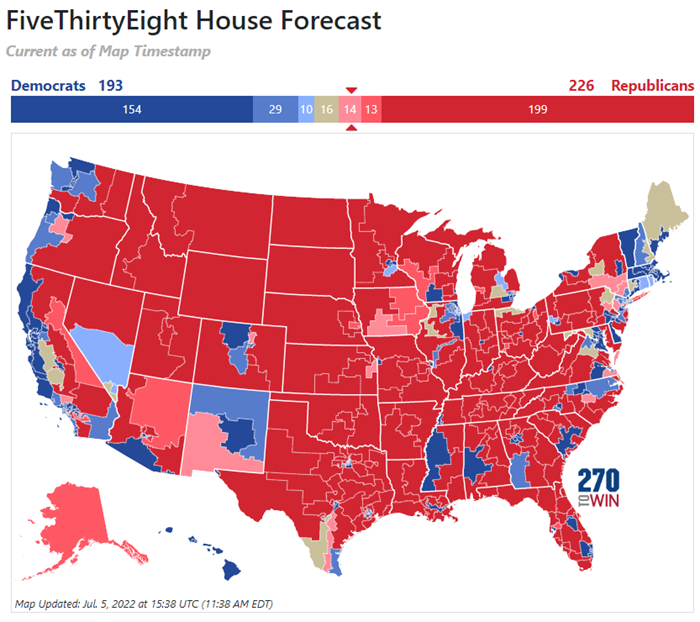
In each map, the Toss-Up tan color is used where neither party currently has a 60% or higher chance of winning. The colored gradients are used to show higher probabilities, deepening as the likelihood of winning increases: Leans (60%+), Likely (75%+), Safe (95%+).
Images below reflect the forecast on the morning of July 5. We will update this through the remainder of the election cycle. Click/tap an image for an interactive version.
Senate
House
Governor