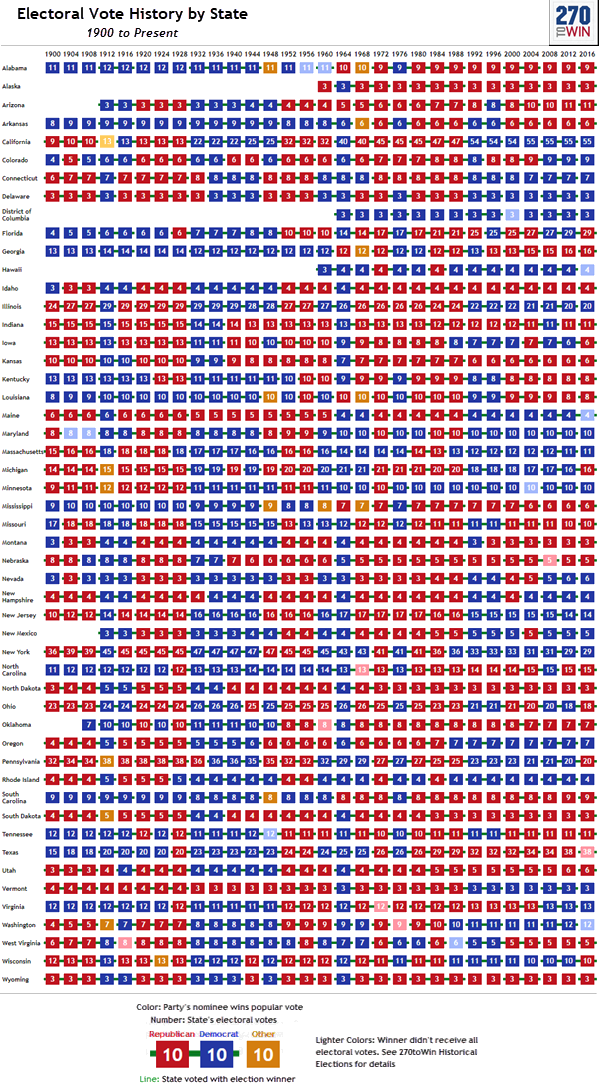
A Handy Chart: Electoral Votes Since 1900
By 270toWin Staff
July 19, 2017
The chart below shows how individual states have voted in each presidential election since 1900. For each state/year, you can view:
- The number of electoral votes allocated to the state
- Which party's nominee won the popular vote
- If the state voted with the person that won the presidential election
- If the winner received fewer than the total electoral votes available
For more information, including a larger version, click/tap the chart, or see the state electoral vote history page.
Headlines
Overview and Live Results: Rhode Island State Senate Special Primary
The seat opened with the April death of long time state Sen. Dominick Ruggerio
Tennessee Republican Rep. Mark Green to Resign from Congress July 20
He previously announced his intention to take a job in the private sector
Reps. Evans and Johnson to Leave House; Now 16 Retirements in 2026 Cycle
Both represent safe seats for the incumbent party; Johnson is running for South Dakota governor
Live Results: New York City Ranked Choice Tabulation
Zohran Mamdani is expected to move one step closer to being certified as the Democratic nominee for mayor
Sen. Thom Tillis Will Not Seek Reelection Next Year
He had come under attack from Trump after voting "no" to advance the president's signature legislation

