If All States Voted Like Maine and Nebraska: Trump 290 Clinton 248
By 270toWin Staff
January 5, 2017
During late December, we published preliminary results of how the 2016 electoral vote would have turned out using some alternative allocation methodologies. Those projections still look good.
While some vote data is still incomplete, we're now able to provide a pretty good estimate of how the map would have looked* if each state voted as they do in Maine and Nebraska.
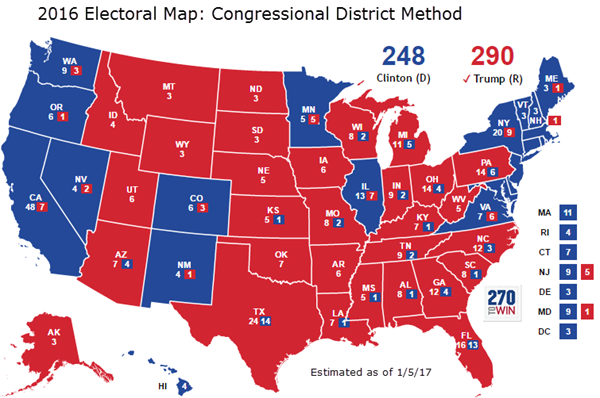
Those two states use the congressional district method, which allocates two electoral votes to the popular vote winner in the state, with one going to the popular vote winner in each individual congressional district. In 2016, this approach led to Donald Trump winning one of Maine's four electoral votes.
The actual electoral map (ignoring faithless electors) was Trump 306, Clinton 232. Moving Maine to winner take all would make it 305-233. Under the congressional district method, 15 electoral votes shift to Clinton, and Trump wins a closer race, by a 290-248 total. This is opposite of what we saw in 2012, when Mitt Romney's 206 electoral votes would have become 274, putting him into the White House.
There aren't that many battleground congressional districts in 2010's-era America. This makes the congressional district method much more stable than winner take all. Trump is estimated to have won 230 congressional districts, little changed from the 226 won by Romney in 2012. He also won 6 states that Romney lost. So, while those six states gave Trump 99 more electoral votes than Romney (excl. Maine district), he only improved on Romney's 274 by 16 (6 states @2 each, 4 districts @1 each) with this allocation methodology applied nationwide.
Thanks to Daily Kos and Kyle Kondik, of Larry Sabato's Crystal Ball, for helping us make this projection as accurate as possible given available data.
*Campaigns make strategic and tactical decisions based on the rules in place. If each state used the methodology discussed here, more resources would have been deployed to 'battleground districts'. That in mind, there's no way to know for sure how the map would have actually turned out.

