Electoral College Projections as of October 19th
By 270toWin Staff
October 19, 2016
As we head into the final presidential debate, and with just under three weeks to go until the 2016 presidential election, here's the state of the race from the viewpoint of 14 forecasters. You can find all the associated maps, as well as a few others, on our 2016 Presidential Election Forecasts page.
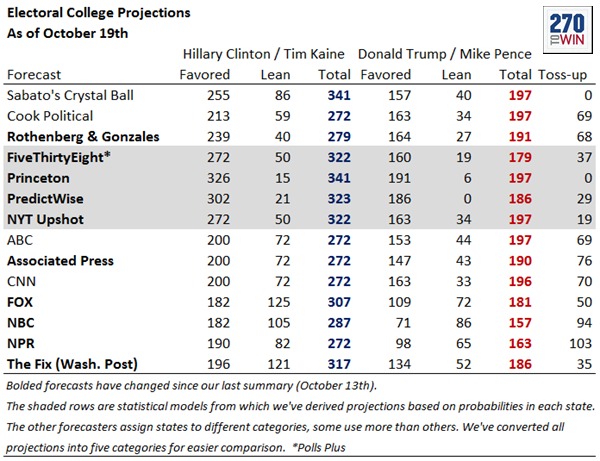
Since our last update on October 13th, both Hillary Clinton and Donald Trump's average total electoral votes are little changed. Clinton is at 300, Trump 187. Within Trump's average, however, we are beginning to see an erosion in states where the Republican nominee is favored vs. those that are leaning in his direction. For example, a couple forecasters have moved Texas from favored to leaning.
Note that the statistical projections (shaded in gray) in the table may change several times a day as new input data (e.g., polls released that day) are processed by the models. This will lead to more variability vs. the other forecasters.

