Historical Timeline
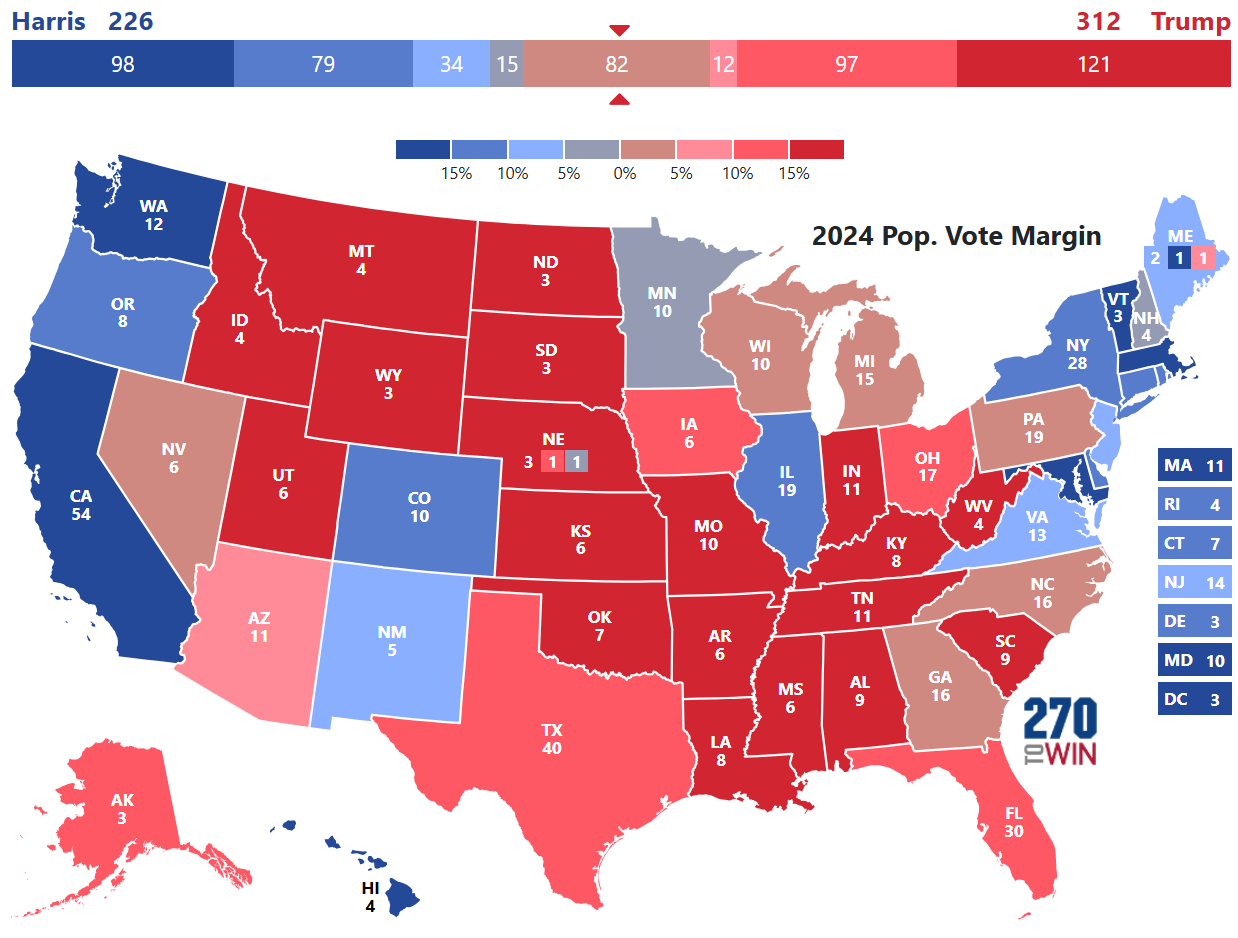
Margin of Victory View
The maps on this page show the relative competitiveness of the states for each presidential election from 1972 through 2024. It is based on the popular vote difference between the Republican and Democratic nominees in that year’s election.
Faithless or uncast electoral votes are shown as dark gray and are excluded. While viewing a specific year, you can click the map to visit its historical election page.