Electoral Maps Based on Different Apportionment Methods
We've created a number of maps with different electoral vote distributions. All the maps are interactive, although they don't have quite as many features as our interactive 2020 electoral map. Note that these changes stick with how electoral votes are allocated today; winner take all except for Maine and Nebraska. To view different methodologies within individual states, see our feature Gaming the Electoral College.
Projected 2024 Electoral Vote Allocation
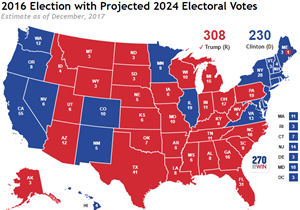 The 2020 census will lead to a reapportionment of congressional districts. As each state receives electoral votes equal to its congressional delegation (House + Senate), the map will change for the 2024 presidential election. This series of maps is based on the most recent projections for the 2020 reapportionment. It looks at how each of the past five presidential elections would have turned out if the projected 2024 map was in use.
Population-Based Electoral Votes
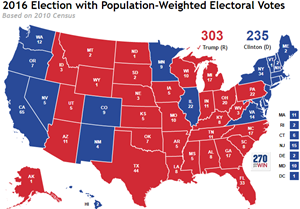 Since all state have two Senators, smaller states are over-represented in the Electoral College. This interactive map shows the number of electoral votes each state would have if only census population was considered and applies it to the 2016 presidential election. Interestingly, despite Clinton winning the popular vote, the electoral map totals would have been little different. Click the image to find out why.
Apportionment Based only on U.S. Citizens
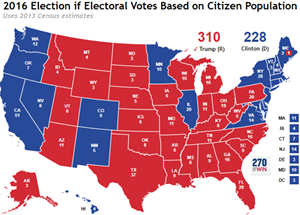 The U.S. Constitution specifies that the census count all residents, whether citizens or not. What if only citizens were considered in determining apportionment? This interactive map looks at how the electoral votes for each state would change in that scenario. This is somewhat - although not exactly - the opposite scenario as the 'Population-based' one immediately above. California would lose 4 electoral votes here; no other state would change by more than one.

