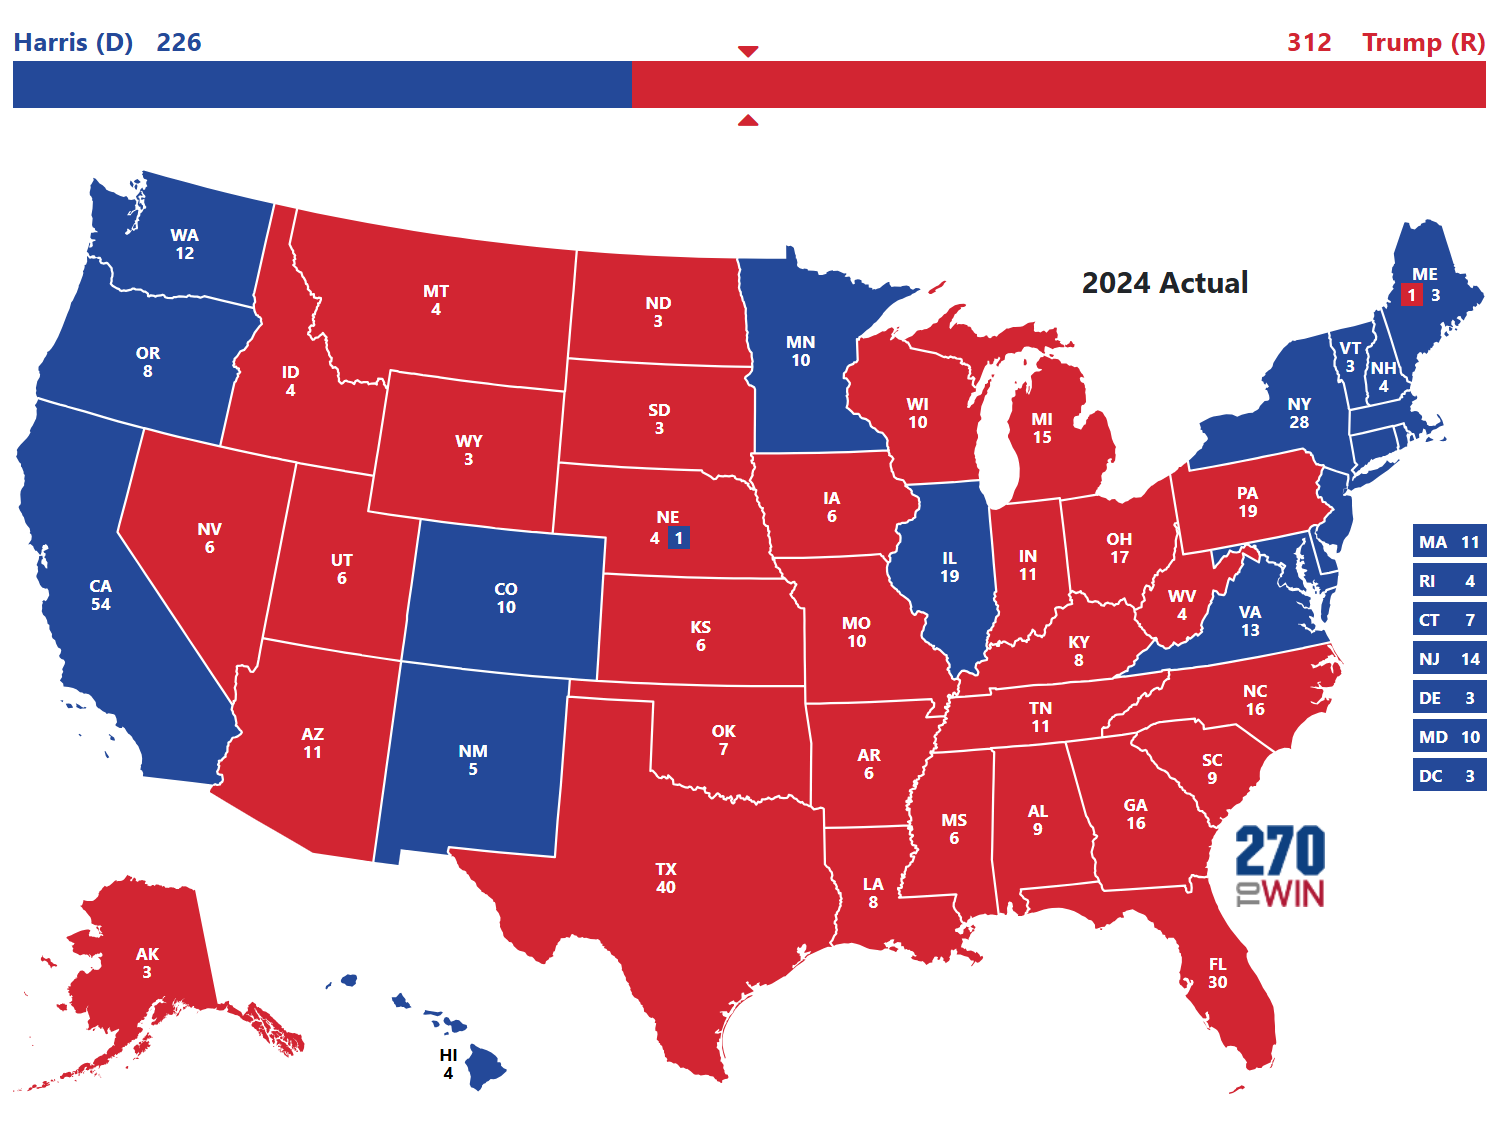
Wisconsin 2024 Presidential Election Polls
Harris vs. Trump
Source
Date
Sample
Harris
Trump
Other
Average of 17 Polls†
48.8%
47.7%
-
FAU / Mainstreet
11/04/2024
786 LV
49%
48%
3%
Emerson College
11/04/2024
800 LV ±3.4%
49%
49%
2%
Research Co.
11/04/2024
450 LV ±4.6%
49%
46%
5%
InsiderAdvantage
11/03/2024
800 LV ±3.4%
48%
49%
3%
Trafalgar Group
11/03/2024
1,086 LV ±2.9%
48%
47%
5%
NY Times / Siena College
11/03/2024
1,305 LV ±3.4%
49%
47%
4%
Morning Consult
11/03/2024
540 LV ±4%
48%
48%
4%
AtlasIntel
11/02/2024
728 LV ±4%
49%
50%
1%
Redfield & Wilton
11/01/2024
932 LV ±3%
48%
47%
5%
The Times (UK) / YouGov
11/01/2024
867 LV ±4.5%
49%
45%
6%
Marist Poll
11/01/2024
1,330 LV ±3.4%
50%
48%
2%
AtlasIntel
10/31/2024
673 LV ±4%
49%
49%
2%
Echelon Insights
10/31/2024
600 LV ±4.5%
49%
49%
2%
Marquette Law School
10/30/2024
753 LV ±4.4%
50%
49%
1%
CNN
10/30/2024
736 LV ±4.8%
51%
45%
4%
Redfield & Wilton
10/29/2024
746 LV ±3.4%
49%
47%
4%
AtlasIntel
10/29/2024
1,470 LV ±3%
49%
49%
2%
InsiderAdvantage
10/29/2024
800 LV ±3.5%
48%
49%
3%
Suffolk University
10/28/2024
500 LV ±4.4%
47%
48%
5%
Redfield & Wilton
10/25/2024
557 LV ±3.9%
49%
47%
4%
Emerson College
10/24/2024
800 LV ±3.4%
48%
49%
3%
Bloomberg / Morning Consult
10/23/2024
624 LV ±4%
48%
48%
4%
Quinnipiac
10/23/2024
1,108 LV ±2.9%
48%
48%
4%
Trafalgar Group
10/21/2024
1,083 LV ±2.9%
47%
47%
6%
Redfield & Wilton
10/21/2024
622 LV ±3.6%
47%
46%
7%
Wash. Post - Schar School
10/21/2024
695 LV ±4.6%
50%
47%
3%
AtlasIntel
10/19/2024
932 LV ±3%
49%
48%
3%
RMG Research
10/17/2024
787 LV ±3.5%
49%
50%
1%
Morning Consult
10/17/2024
527 LV ±4%
47%
48%
5%
Redfield & Wilton
10/16/2024
772 LV ±3.5%
47%
48%
5%
Wall Street Journal
10/11/2024
600 RV ±4%
48%
48%
4%
InsiderAdvantage
10/10/2024
800 LV ±3.5%
48%
48%
4%
Emerson College
10/10/2024
1,000 LV ±3%
49%
50%
1%
GSG / NSOR
10/09/2024
408 LV ±4.9%
48%
46%
6%
Quinnipiac
10/09/2024
1,073 LV ±3%
47%
49%
4%
Research Co.
10/08/2024
450 LV ±4.6%
47%
45%
8%
Redfield & Wilton
10/07/2024
533 LV ±4%
47%
46%
7%
Marquette Law School
10/02/2024
798 LV ±4.4%
52%
48%
0%
Trafalgar Group
10/02/2024
1,079 LV ±2.9%
46%
47%
7%
Cook Political/BSG/GS Strategy
10/02/2024
411 LV
49%
47%
4%
AtlasIntel
9/28/2024
1,077 LV ±3%
48%
50%
2%
NY Times / Siena College
9/28/2024
680 LV ±4.4%
49%
47%
4%
Bloomberg / Morning Consult
9/26/2024
785 LV ±3%
51%
48%
1%
RMG Research
9/26/2024
788 LV ±3.5%
50%
49%
1%
Redfield & Wilton
9/23/2024
600 LV ±3.7%
47%
47%
6%
MassINC
9/23/2024
800 LV ±3.8%
53%
46%
1%
Morning Consult
9/19/2024
600 LV ±4.1%
50%
44%
6%
Emerson College
9/19/2024
1,000 LV ±3%
48%
49%
3%
Marist Poll
9/19/2024
1,194 LV ±3.6%
50%
49%
1%
Quinnipiac
9/18/2024
1,075 LV ±3%
49%
48%
3%
AARP
9/18/2024
600 LV ±4%
49%
48%
3%
InsiderAdvantage
9/14/2024
800 LV ±3.5%
49%
47%
4%
Marquette Law School
9/11/2024
738 LV ±4.7%
52%
48%
0%
Redfield & Wilton
9/10/2024
626 LV ±3.7%
49%
46%
5%
Morning Consult
9/09/2024
627 LV ±4%
49%
46%
5%
CBS / YouGov
9/08/2024
958 LV ±4%
51%
49%
0%
The Times (UK) / YouGov
9/05/2024
900 RV ±4.1%
47%
44%
9%
CNN
9/04/2024
976 LV ±4.4%
50%
44%
6%
Trafalgar Group
8/31/2024
1,083 LV ±2.9%
46%
47%
7%
Redfield & Wilton
8/30/2024
672 LV ±3.6%
48%
44%
8%
Bloomberg / Morning Consult
8/29/2024
701 LV ±4%
52%
44%
4%
Emerson College
8/29/2024
850 LV ±3.3%
48%
49%
3%
Redfield & Wilton
8/19/2024
469 LV ±4.2%
48%
44%
8%
American Greatness/TIPP
8/15/2024
976 LV ±3.4%
47%
47%
6%
Cook Political/BSG/GS Strategy
8/14/2024
404 LV
49%
46%
5%
Independent Center
8/12/2024
500 RV ±4.4%
51%
42%
7%
NY Times / Siena College
8/10/2024
661 LV ±4.3%
50%
46%
4%
InsiderAdvantage
8/09/2024
800 LV ±3.7%
48%
49%
3%
RMG Research
8/08/2024
800 RV ±3.5%
48%
45%
7%
Marquette Law School
8/07/2024
778 LV ±4.8%
50%
49%
1%
Redfield & Wilton
8/06/2024
597 LV ±3.7%
43%
43%
14%
Public Opinion Strategies
8/01/2024
400 LV
48%
46%
6%
Bloomberg / Morning Consult
7/30/2024
700 RV ±4%
49%
47%
4%
Fox News
7/26/2024
1,046 RV ±3%
49%
50%
1%
Redfield & Wilton
7/26/2024
523 LV ±3.9%
44%
44%
12%
Emerson College
7/25/2024
845 RV ±3.3%
47%
47%
6%
Public Policy
7/22/2024
548 RV
48%
49%
3%
North Star Opinion Research
7/12/2024
600 LV ±4%
47%
48%
5%
Bloomberg / Morning Consult
5/22/2024
693 RV ±4%
41%
49%
10%
Emerson College
2/27/2024
1,000 RV ±3%
44%
47%
9%
NY Times / Siena College
11/05/2023
603 RV ±4.8%
46%
47%
7%
Close Compare
Harris vs. TrumpIncluding Third Parties and Independents
A separate average calculation for the subset of polls that have a question that names one or more notable candidates in addition to Harris and Trump. The inclusion of these names can significantly influence the polling average.
Biden vs. TrumpIncludes polls recorded through the president' withdrawal from the race on July 21, 2024.
Source
Date
Sample
Biden
Trump
Other
Average of 5 Polls†
42.0%
45.0%
-
Redfield & Wilton
7/21/2024
470 LV ±4.1%
42%
42%
16%
Trafalgar Group
7/18/2024
1,087 LV ±2.9%
43%
46%
11%
Emerson College
7/18/2024
1,000 RV ±3%
43%
48%
9%
The Times (UK) / YouGov
7/15/2024
900 RV ±4.1%
38%
43%
19%
North Star Opinion Research
7/12/2024
600 LV ±4%
44%
46%
10%
AARP
7/09/2024
600 LV ±4%
45%
50%
5%
Bloomberg / Morning Consult
7/06/2024
695 RV ±4%
47%
44%
9%
Emerson College
7/02/2024
1,000 RV ±3%
44%
47%
9%
Marquette Law School
6/26/2024
784 LV ±4.9%
51%
49%
0%
Emerson College
6/20/2024
1,000 RV ±3%
44%
47%
9%
J.L. Partners
6/13/2024
500 LV ±4.3%
44%
44%
12%
FAU / Mainstreet
6/04/2024
290 LV
40%
41%
19%
Cook Political/BSG/GS Strategy
5/23/2024
503 LV ±4.4%
45%
45%
10%
Bloomberg / Morning Consult
5/22/2024
693 RV ±4%
46%
47%
7%
NY Times / Siena College
5/13/2024
614 RV ±4%
47%
45%
8%
Quinnipiac
5/08/2024
1,457 RV ±2.6%
50%
44%
6%
Emerson College
4/30/2024
1,000 RV ±3%
45%
47%
8%
CBS / YouGov
4/28/2024
1,245 LV ±3.2%
49%
50%
1%
Bloomberg / Morning Consult
4/24/2024
702 RV ±4%
44%
48%
8%
Fox News
4/18/2024
1,198 RV ±2.5%
48%
48%
4%
Marquette Law School
4/17/2024
814 RV ±4.8%
44%
47%
9%
Wall Street Journal
4/02/2024
600 RV ±4%
46%
46%
8%
Bloomberg / Morning Consult
3/26/2024
697 RV ±4%
46%
45%
9%
Emerson College
3/21/2024
1,000 RV ±3%
43%
46%
11%
Bloomberg / Morning Consult
2/29/2024
702 RV ±4%
42%
46%
12%
Emerson College
2/27/2024
1,000 RV ±3%
42%
45%
13%
Marquette Law School
2/07/2024
808 LV ±4.4%
49%
50%
1%
Fox News
2/01/2024
1,172 RV ±3%
47%
47%
6%
Bloomberg / Morning Consult
1/31/2024
697 RV ±4%
44%
49%
7%
Bloomberg / Morning Consult
12/14/2023
681 RV ±4%
41%
45%
14%
J.L. Partners
12/04/2023
550 LV ±4.2%
37%
32%
31%
Bloomberg / Morning Consult
11/09/2023
675 RV ±4%
46%
47%
7%
Emerson College
11/09/2023
819 LV ±3%
45%
45%
10%
Marquette Law School
11/08/2023
908 RV ±4.5%
50%
48%
2%
NY Times / Siena College
11/05/2023
603 RV ±4.8%
47%
45%
8%
Bloomberg / Morning Consult
10/19/2023
700 RV ±4%
44%
46%
10%
Emerson College
10/12/2023
532 RV ±4.2%
40%
42%
18%
Marquette Law School
6/28/2023
913 RV ±4.3%
52%
43%
5%
Public Opinion Strategies
4/21/2023
500 RV ±4.4%
47%
43%
10%
Close Compare
Biden vs. TrumpIncluding Third Parties and Independents
A separate average calculation for the subset of polls that have a question that names one or more notable candidates in addition to Biden and Trump. The inclusion of these names can significantly influence the polling average.
Source
Date
Sample
Biden
Stein
Kennedy
West
Oliver
Trump
Other
Average of 5 Polls†
40.4%
1.4%
5.6%
0.3%
0.8%
43.0%
-
Redfield & Wilton
7/21/2024
470 LV ±4.1%
42%
1%
6%
-
0%
42%
9%
Trafalgar Group
7/18/2024
1,087 LV ±2.9%
43%
1%
3%
0%
0%
46%
7%
Emerson College
7/18/2024
1,000 RV ±3%
43%
1%
4%
0%
1%
46%
5%
The Times (UK) / YouGov
7/15/2024
900 RV ±4.1%
38%
1%
4%
1%
-
43%
13%
North Star Opinion Research
7/12/2024
600 LV ±4%
36%
3%
11%
-
2%
38%
10%
AARP
7/09/2024
600 LV ±4%
38%
3%
9%
-
1%
44%
5%
Bloomberg / Morning Consult
7/06/2024
695 RV ±4%
41%
1%
10%
1%
0%
39%
8%
Emerson College
7/02/2024
1,000 RV ±3%
40%
2%
6%
1%
1%
43%
7%
Marquette Law School
6/26/2024
784 LV ±4.9%
42%
2%
7%
3%
1%
44%
1%
Emerson College
6/20/2024
1,000 RV ±3%
42%
1%
6%
0%
-
44%
7%
J.L. Partners
6/13/2024
500 LV ±4.3%
44%
0%
5%
0%
-
44%
7%
Cook Political/BSG/GS Strategy
5/23/2024
503 LV ±4.4%
41%
1%
9%
1%
-
41%
7%
Bloomberg / Morning Consult
5/22/2024
693 RV ±4%
42%
1%
6%
1%
-
43%
7%
NY Times / Siena College
5/13/2024
614 RV ±4%
38%
1%
9%
0%
-
38%
14%
Quinnipiac
5/08/2024
1,457 RV ±2.6%
40%
4%
12%
1%
-
39%
4%
Emerson College
4/30/2024
1,000 RV ±3%
40%
1%
6%
1%
-
45%
7%
CBS / YouGov
4/28/2024
1,245 LV ±3.2%
44%
8%
-
-
-
48%
0%
Bloomberg / Morning Consult
4/24/2024
702 RV ±4%
41%
1%
8%
1%
-
44%
5%
Fox News
4/18/2024
1,198 RV ±2.5%
43%
2%
9%
2%
-
41%
3%
Marquette Law School
4/17/2024
814 RV ±4.8%
40%
3%
13%
2%
-
41%
1%
Wall Street Journal
4/02/2024
600 RV ±4%
41%
1%
10%
1%
-
38%
9%
Emerson College
3/21/2024
1,000 RV ±3%
40%
1%
6%
1%
-
43%
9%
Emerson College
2/27/2024
1,000 RV ±3%
37%
1%
7%
1%
-
41%
13%
Marquette Law School
2/07/2024
808 LV ±4.4%
39%
4%
13%
2%
-
41%
1%
Fox News
2/01/2024
1,172 RV ±3%
39%
2%
7%
1%
-
42%
9%
Bloomberg / Morning Consult
1/31/2024
697 RV ±4%
35%
2%
10%
0%
-
43%
10%
Bloomberg / Morning Consult
12/14/2023
681 RV ±4%
34%
3%
10%
1%
-
40%
12%
J.L. Partners
12/04/2023
550 LV ±4.2%
37%
1%
6%
1%
-
32%
23%
Bloomberg / Morning Consult
11/09/2023
675 RV ±4%
36%
-
13%
2%
-
38%
11%
NY Times / Siena College
11/05/2023
603 RV ±4.8%
37%
-
22%
-
-
35%
6%
Close Compare
When did it last happen?
This feature shows the most recent election where the state voted with or against the presidential winner in each party. Click the year to see the corresponding electoral map and results.