New Mexico 2020 Presidential Election Polls
Biden vs. Trump
| Source | Date | Sample | Biden | Trump | Other | |
|---|---|---|---|---|---|---|
| Poll Averages† | 53.5% | 40.5% | - | |||
| Albuquerque Journal | 11/01/2020 | 1,180 LV ±2.9% | 54% | 42% | 4% | |
| Public Policy | 10/06/2020 | 886 LV ±3.3% | 53% | 39% | 8% | |
| Albuquerque Journal | 9/06/2020 | 1,123 LV ±2.9% | 54% | 39% | 7% | |
| Public Policy | 6/16/2020 | 740 RV ±3.6% | 53% | 39% | 8% | |
| Public Policy | 4/24/2020 | 1,009 RV ±3.1% | 52% | 40% | 8% | |
| Emerson College | 1/06/2020 | 967 RV ±3.1% | 54% | 46% | 0% | |
† The average includes the most recent poll from each source within the past 30 days, up to a maximum of five. If five polls are found, and there are other qualifying polls on that same calendar date, those will also be included.
Including Third Parties
No Polls Available
When did it last happen?
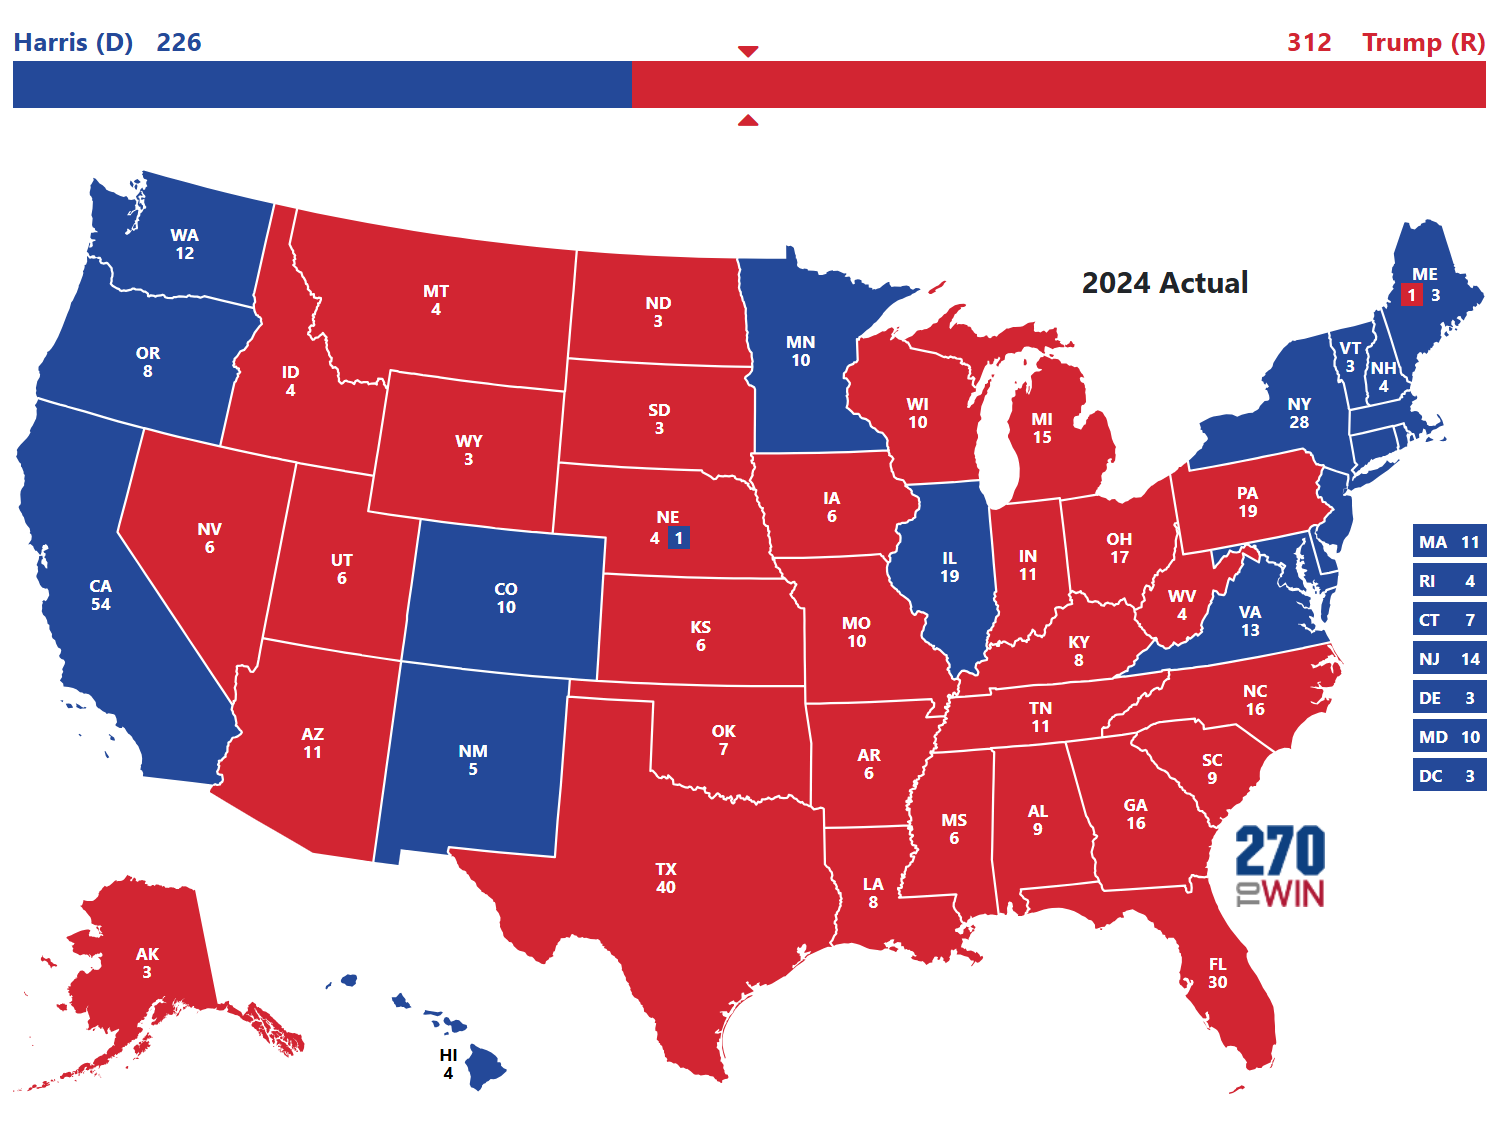
This feature shows the most recent election where the state voted with or against the presidential winner in each party. Click the year to see the corresponding electoral map and results.New Mexico Winner
Harris
Biden
Bush
Ford
Election Winner
Trump
Biden
Bush
Carter
2024
2020
2004
1976