2018 North Carolina House Election Interactive Map
All US House seats to be contested in 2018
North Carolina has 13 congressional districts. 10 are held by Republicans, 3 by Democrats. GOP Rep. Rob Pittenger (NC-9) lost his primary; this is seen as a good pick-up opportunity for Democrats. The GOP-held 13th district is also expected to be highly competitive.
To create your own forecast for the midterms, visit the 2018 House Interactive Map.

Hover over a district for details.
| District | Incumbent | Party | Since | Term | Predictions | Margin of Victory | ||||||||||||||||||||||||||||||||||||||||||||||||||||||||||||||||||||||||||||||||||||||||||||
|---|---|---|---|---|---|---|---|---|---|---|---|---|---|---|---|---|---|---|---|---|---|---|---|---|---|---|---|---|---|---|---|---|---|---|---|---|---|---|---|---|---|---|---|---|---|---|---|---|---|---|---|---|---|---|---|---|---|---|---|---|---|---|---|---|---|---|---|---|---|---|---|---|---|---|---|---|---|---|---|---|---|---|---|---|---|---|---|---|---|---|---|---|---|---|---|---|---|---|
| Pro | Map | House(a) | President(b) | |||||||||||||||||||||||||||||||||||||||||||||||||||||||||||||||||||||||||||||||||||||||||||||||
| NC-2 |  |
George Holding | 2013 | 3rd |
|
13.4% | 9.6% | |||||||||||||||||||||||||||||||||||||||||||||||||||||||||||||||||||||||||||||||||||||||||||
| NC-8 |  |
Richard Hudson | 2013 | 3rd |
|
17.5% | 15.0% | |||||||||||||||||||||||||||||||||||||||||||||||||||||||||||||||||||||||||||||||||||||||||||
| NC-9 | 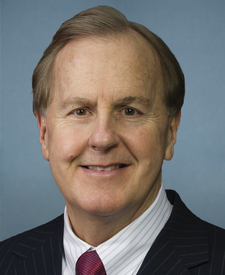 |
Robert Pittenger | 2013 | 3rd |
|
16.4% | 11.6% | |||||||||||||||||||||||||||||||||||||||||||||||||||||||||||||||||||||||||||||||||||||||||||
|
Incumbent defeated in primary for 2018 election.
|
||||||||||||||||||||||||||||||||||||||||||||||||||||||||||||||||||||||||||||||||||||||||||||||||||
| NC-13 |  |
Ted Budd | 2017 | 1st |
|
12.2% | 9.4% | |||||||||||||||||||||||||||||||||||||||||||||||||||||||||||||||||||||||||||||||||||||||||||
| NC-1 | 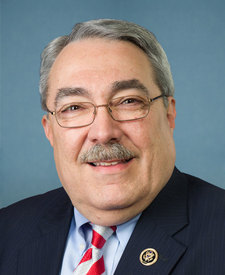 |
G. K. Butterfield | 2004 | 8th |
|
39.7% | 37.0% | |||||||||||||||||||||||||||||||||||||||||||||||||||||||||||||||||||||||||||||||||||||||||||
| NC-3 |  |
Walter Jones | 1995 | 12th |
|
34.4% | 23.6% | |||||||||||||||||||||||||||||||||||||||||||||||||||||||||||||||||||||||||||||||||||||||||||
| NC-4 |  |
David Price | 1997 | 11th |
|
36.4% | 40.0% | |||||||||||||||||||||||||||||||||||||||||||||||||||||||||||||||||||||||||||||||||||||||||||
| NC-5 | 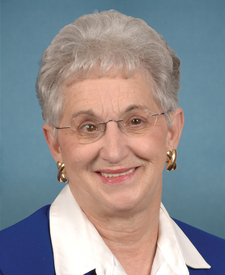 |
Virginia Foxx | 2005 | 7th |
|
16.8% | 17.6% | |||||||||||||||||||||||||||||||||||||||||||||||||||||||||||||||||||||||||||||||||||||||||||
| NC-6 |  |
Mark Walker | 2015 | 2nd |
|
18.5% | 14.7% | |||||||||||||||||||||||||||||||||||||||||||||||||||||||||||||||||||||||||||||||||||||||||||
| NC-7 | 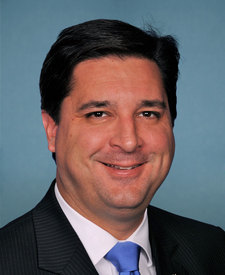 |
David Rouzer | 2015 | 2nd |
|
21.8% | 17.7% | |||||||||||||||||||||||||||||||||||||||||||||||||||||||||||||||||||||||||||||||||||||||||||
| NC-10 |  |
Patrick McHenry | 2005 | 7th |
|
26.3% | 24.6% | |||||||||||||||||||||||||||||||||||||||||||||||||||||||||||||||||||||||||||||||||||||||||||
| NC-11 | 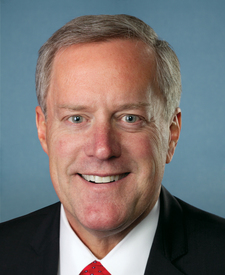 |
Mark Meadows | 2013 | 3rd |
|
28.2% | 29.2% | |||||||||||||||||||||||||||||||||||||||||||||||||||||||||||||||||||||||||||||||||||||||||||
| NC-12 | 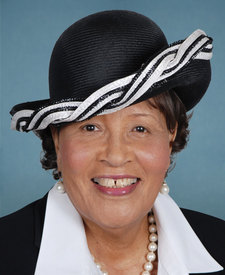 |
Alma Adams | 2014 | 3rd |
|
34.0% | 40.0% | |||||||||||||||||||||||||||||||||||||||||||||||||||||||||||||||||||||||||||||||||||||||||||
(a)Source: Ballotpedia (for margins). The margin is the percentage difference between the top two vote-getters in 2016.
More recent results (i.e., special elections held in 2017-18 for vacancies) are not displayed.
* Race was uncontested | ^Top two vote-getters were from the same party
(b)Source: Daily Kos. The margin is the percentage difference between Donald Trump and Hillary Clinton.

