2018 Georgia House Election Interactive Map
All US House seats to be contested in 2018
Georgia has 14 congressional districts, of which six are primarily within the Atlanta metro area. The state delegation includes 10 Republicans and 4 Democrats. 12 of the 14 seats are considered safe in 2018. Only the 6th and 7th districts, in the northern Atlanta suburbs, look somewhat competitive.
To create your own forecast for the midterms, visit the 2018 House Interactive Map.

Hover over a district for details.
| District | Incumbent | Party | Since | Term | Predictions | Margin of Victory | ||||||||||||||||||||||||||||||||||||||||||||||||||||||||||||||||||||||||||||||||||||||||||||
|---|---|---|---|---|---|---|---|---|---|---|---|---|---|---|---|---|---|---|---|---|---|---|---|---|---|---|---|---|---|---|---|---|---|---|---|---|---|---|---|---|---|---|---|---|---|---|---|---|---|---|---|---|---|---|---|---|---|---|---|---|---|---|---|---|---|---|---|---|---|---|---|---|---|---|---|---|---|---|---|---|---|---|---|---|---|---|---|---|---|---|---|---|---|---|---|---|---|---|
| Pro | Map | House(a) | President(b) | |||||||||||||||||||||||||||||||||||||||||||||||||||||||||||||||||||||||||||||||||||||||||||||||
| GA-6 |  |
Karen Handel | 2017 | 1st |
|
23.4% | 1.5% | |||||||||||||||||||||||||||||||||||||||||||||||||||||||||||||||||||||||||||||||||||||||||||
| GA-7 | 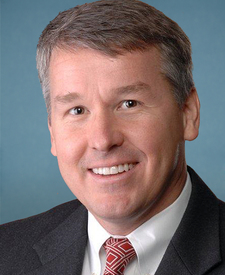 |
Rob Woodall | 2011 | 4th |
|
20.8% | 6.3% | |||||||||||||||||||||||||||||||||||||||||||||||||||||||||||||||||||||||||||||||||||||||||||
| GA-1 |  |
Buddy Carter | 2015 | 2nd |
|
* | 15.5% | |||||||||||||||||||||||||||||||||||||||||||||||||||||||||||||||||||||||||||||||||||||||||||
| GA-2 | 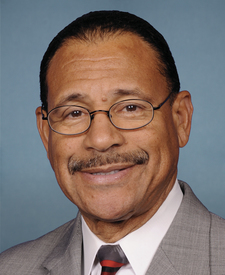 |
Sanford D. Jr. Bishop | 1993 | 13th |
|
22.5% | 11.7% | |||||||||||||||||||||||||||||||||||||||||||||||||||||||||||||||||||||||||||||||||||||||||||
| GA-3 |  |
Drew Ferguson | 2017 | 1st |
|
36.7% | 31.5% | |||||||||||||||||||||||||||||||||||||||||||||||||||||||||||||||||||||||||||||||||||||||||||
| GA-4 |  |
Henry C. 'Hank' Jr. Johnson | 2007 | 6th |
|
51.4% | 53.1% | |||||||||||||||||||||||||||||||||||||||||||||||||||||||||||||||||||||||||||||||||||||||||||
| GA-5 | 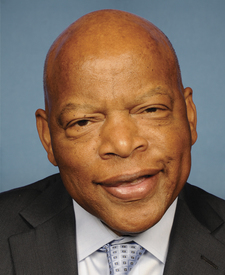 |
John Lewis | 1987 | 16th |
|
68.9% | 73.1% | |||||||||||||||||||||||||||||||||||||||||||||||||||||||||||||||||||||||||||||||||||||||||||
| GA-8 |  |
Austin Scott | 2011 | 4th |
|
35.3% | 28.9% | |||||||||||||||||||||||||||||||||||||||||||||||||||||||||||||||||||||||||||||||||||||||||||
| GA-9 |  |
Doug Collins | 2013 | 3rd |
|
* | 58.5% | |||||||||||||||||||||||||||||||||||||||||||||||||||||||||||||||||||||||||||||||||||||||||||
| GA-10 | 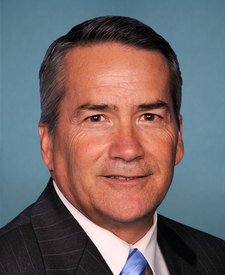 |
Jody Hice | 2015 | 2nd |
|
* | 25.5% | |||||||||||||||||||||||||||||||||||||||||||||||||||||||||||||||||||||||||||||||||||||||||||
| GA-11 |  |
Barry Loudermilk | 2015 | 2nd |
|
34.8% | 25.0% | |||||||||||||||||||||||||||||||||||||||||||||||||||||||||||||||||||||||||||||||||||||||||||
| GA-12 | 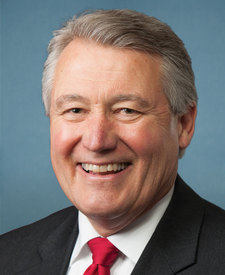 |
Rick Allen | 2015 | 2nd |
|
23.2% | 16.2% | |||||||||||||||||||||||||||||||||||||||||||||||||||||||||||||||||||||||||||||||||||||||||||
| GA-13 | 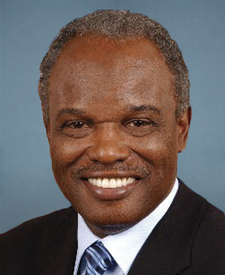 |
David Scott | 2003 | 8th |
|
* | 44.4% | |||||||||||||||||||||||||||||||||||||||||||||||||||||||||||||||||||||||||||||||||||||||||||
| GA-14 |  |
Tom Graves | 2010 | 5th |
|
* | 52.9% | |||||||||||||||||||||||||||||||||||||||||||||||||||||||||||||||||||||||||||||||||||||||||||
(a)Source: Ballotpedia (for margins). The margin is the percentage difference between the top two vote-getters in 2016.
More recent results (i.e., special elections held in 2017-18 for vacancies) are not displayed.
* Race was uncontested | ^Top two vote-getters were from the same party
(b)Source: Daily Kos. The margin is the percentage difference between Donald Trump and Hillary Clinton.

