2020 Pennsylvania House Election Interactive Map
All US House seats to be contested in 2020
Pennsylvania has 18 congressional districts, split 9-9 between the two parties. This partisan balance came about after court-ordered redistricting was put in place for the 2018 elections to reduce what was determined to be an illegal gerrymander.
2020 will be the final election with this map, as redistricting will occur in 2021 after the 2020 Census. Pennsylvania is expected to lose a congressional district. The new districts will be first contested in the 2022 election.
To create and share your own forecast, visit the 2020 House Interactive Map.

Hover over a district for details.
| District | Incumbent | Party | Since | Term | Predictions | Margin of Victory | ||||||||||||||||||||||||||||||||||||||||||||||||||||||||||||||||||||||||||||||||||||||||||||
|---|---|---|---|---|---|---|---|---|---|---|---|---|---|---|---|---|---|---|---|---|---|---|---|---|---|---|---|---|---|---|---|---|---|---|---|---|---|---|---|---|---|---|---|---|---|---|---|---|---|---|---|---|---|---|---|---|---|---|---|---|---|---|---|---|---|---|---|---|---|---|---|---|---|---|---|---|---|---|---|---|---|---|---|---|---|---|---|---|---|---|---|---|---|---|---|---|---|---|
| Pro | Map | House(a) | President(b) | |||||||||||||||||||||||||||||||||||||||||||||||||||||||||||||||||||||||||||||||||||||||||||||||
| PA-1 |  |
Brian Fitzpatrick | 2017 | 2nd |
|
2.5% | 2.0% | |||||||||||||||||||||||||||||||||||||||||||||||||||||||||||||||||||||||||||||||||||||||||||
|
Christina Finello
Brian Fitzpatrick*
|
||||||||||||||||||||||||||||||||||||||||||||||||||||||||||||||||||||||||||||||||||||||||||||||||||
| PA-7 | 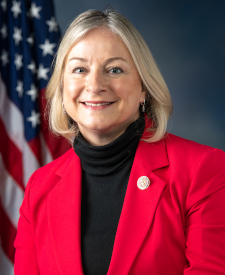 |
Susan Wild | 2018 | 2nd |
|
10.0% | 1.1% | |||||||||||||||||||||||||||||||||||||||||||||||||||||||||||||||||||||||||||||||||||||||||||
|
Susan Wild*
Lisa Scheller
|
||||||||||||||||||||||||||||||||||||||||||||||||||||||||||||||||||||||||||||||||||||||||||||||||||
| PA-8 | 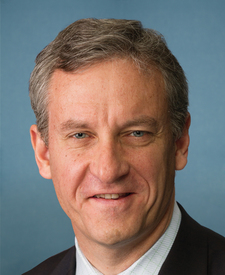 |
Matthew Cartwright | 2013 | 4th |
|
9.2% | 9.5% | |||||||||||||||||||||||||||||||||||||||||||||||||||||||||||||||||||||||||||||||||||||||||||
|
Matt Cartwright*
James Bognet
|
||||||||||||||||||||||||||||||||||||||||||||||||||||||||||||||||||||||||||||||||||||||||||||||||||
| PA-10 |  |
Scott Perry | 2013 | 4th |
|
2.6% | 8.9% | |||||||||||||||||||||||||||||||||||||||||||||||||||||||||||||||||||||||||||||||||||||||||||
|
Eugenio DePasquale
Scott Perry*
|
||||||||||||||||||||||||||||||||||||||||||||||||||||||||||||||||||||||||||||||||||||||||||||||||||
| PA-16 | 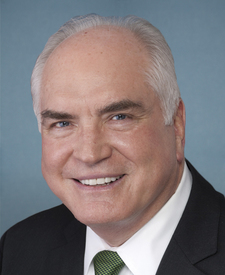 |
Mike Kelly | 2011 | 5th |
|
4.2% | 19.9% | |||||||||||||||||||||||||||||||||||||||||||||||||||||||||||||||||||||||||||||||||||||||||||
|
Kristy Gnibus
George Kelly*
|
||||||||||||||||||||||||||||||||||||||||||||||||||||||||||||||||||||||||||||||||||||||||||||||||||
| PA-17 |  |
Conor Lamb | 2018 | 2nd |
|
12.5% | 2.5% | |||||||||||||||||||||||||||||||||||||||||||||||||||||||||||||||||||||||||||||||||||||||||||
|
Conor Lamb*
Sean Parnell
|
||||||||||||||||||||||||||||||||||||||||||||||||||||||||||||||||||||||||||||||||||||||||||||||||||
| PA-2 |  |
Brendan Boyle | 2015 | 3rd |
|
58.0% | 48.0% | |||||||||||||||||||||||||||||||||||||||||||||||||||||||||||||||||||||||||||||||||||||||||||
|
Brendan Boyle*
David Torres
|
||||||||||||||||||||||||||||||||||||||||||||||||||||||||||||||||||||||||||||||||||||||||||||||||||
| PA-3 |  |
Dwight Evans | 2016 | 3rd |
|
86.7% | 83.9% | |||||||||||||||||||||||||||||||||||||||||||||||||||||||||||||||||||||||||||||||||||||||||||
|
Dwight Evans*
Michael Harvey
|
||||||||||||||||||||||||||||||||||||||||||||||||||||||||||||||||||||||||||||||||||||||||||||||||||
| PA-4 | 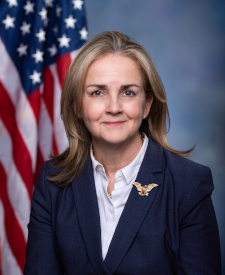 |
Madeleine Dean | 2019 | 1st |
|
27.0% | 19.4% | |||||||||||||||||||||||||||||||||||||||||||||||||||||||||||||||||||||||||||||||||||||||||||
|
Madeleine Dean Cunnane*
Kathy Barnette
|
||||||||||||||||||||||||||||||||||||||||||||||||||||||||||||||||||||||||||||||||||||||||||||||||||
| PA-5 |  |
Mary Scanlon | 2018 | 2nd |
|
30.3% | 28.2% | |||||||||||||||||||||||||||||||||||||||||||||||||||||||||||||||||||||||||||||||||||||||||||
|
Mary Scanlon*
Dasha Pruett
|
||||||||||||||||||||||||||||||||||||||||||||||||||||||||||||||||||||||||||||||||||||||||||||||||||
| PA-6 |  |
Chrissy Houlahan | 2019 | 1st |
|
17.7% | 9.3% | |||||||||||||||||||||||||||||||||||||||||||||||||||||||||||||||||||||||||||||||||||||||||||
|
Christina Houlahan*
John Emmons
|
||||||||||||||||||||||||||||||||||||||||||||||||||||||||||||||||||||||||||||||||||||||||||||||||||
| PA-9 |  |
Dan Meuser | 2019 | 1st |
|
19.4% | 34.0% | |||||||||||||||||||||||||||||||||||||||||||||||||||||||||||||||||||||||||||||||||||||||||||
|
Gary Wegman
Daniel Meuser*
|
||||||||||||||||||||||||||||||||||||||||||||||||||||||||||||||||||||||||||||||||||||||||||||||||||
| PA-11 |  |
Lloyd Smucker | 2017 | 2nd |
|
17.1% | 25.8% | |||||||||||||||||||||||||||||||||||||||||||||||||||||||||||||||||||||||||||||||||||||||||||
|
Sarah Hammond
Lloyd Smucker*
|
||||||||||||||||||||||||||||||||||||||||||||||||||||||||||||||||||||||||||||||||||||||||||||||||||
| PA-12 |  |
Fred Keller | 2019 | 1st |
|
32.0% | 36.5% | |||||||||||||||||||||||||||||||||||||||||||||||||||||||||||||||||||||||||||||||||||||||||||
|
Lee Griffin
Fred Keller*
|
||||||||||||||||||||||||||||||||||||||||||||||||||||||||||||||||||||||||||||||||||||||||||||||||||
| PA-13 | 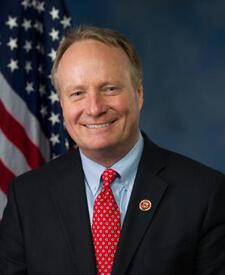 |
John Joyce | 2019 | 1st |
|
40.9% | 45.5% | |||||||||||||||||||||||||||||||||||||||||||||||||||||||||||||||||||||||||||||||||||||||||||
|
Todd Rowley
John Joyce*
|
||||||||||||||||||||||||||||||||||||||||||||||||||||||||||||||||||||||||||||||||||||||||||||||||||
| PA-14 | 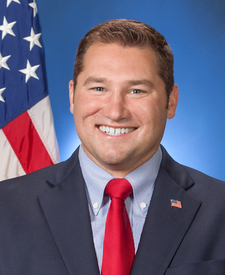 |
Guy Reschenthaler | 2019 | 1st |
|
15.9% | 29.0% | |||||||||||||||||||||||||||||||||||||||||||||||||||||||||||||||||||||||||||||||||||||||||||
|
William Marx
Guy Reschenthaler*
|
||||||||||||||||||||||||||||||||||||||||||||||||||||||||||||||||||||||||||||||||||||||||||||||||||
| PA-15 | 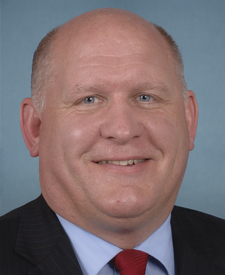 |
Glenn Thompson | 2009 | 6th |
|
35.6% | 43.4% | |||||||||||||||||||||||||||||||||||||||||||||||||||||||||||||||||||||||||||||||||||||||||||
|
Robert Williams
Glenn Thompson*
|
||||||||||||||||||||||||||||||||||||||||||||||||||||||||||||||||||||||||||||||||||||||||||||||||||
| PA-18 | 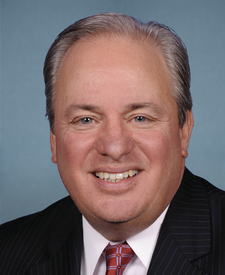 |
Michael Doyle | 1995 | 13th |
|
† | 26.8% | |||||||||||||||||||||||||||||||||||||||||||||||||||||||||||||||||||||||||||||||||||||||||||
|
Michael Doyle*
Luke Negron
|
||||||||||||||||||||||||||||||||||||||||||||||||||||||||||||||||||||||||||||||||||||||||||||||||||
(a)Source: Daily Kos, 270toWin research. The margin is the percentage difference between the top two vote-getters in 2018.
More recent results (i.e., special elections held in 2019-20 for vacancies) are not displayed.
† Race was uncontested | ^Top two vote-getters were from the same party
(b)Source: Daily Kos. The margin is the percentage difference between Donald Trump and Hillary Clinton.

