JHK Forecasts Presidential Election Forecast
Current as of Map Timestamp
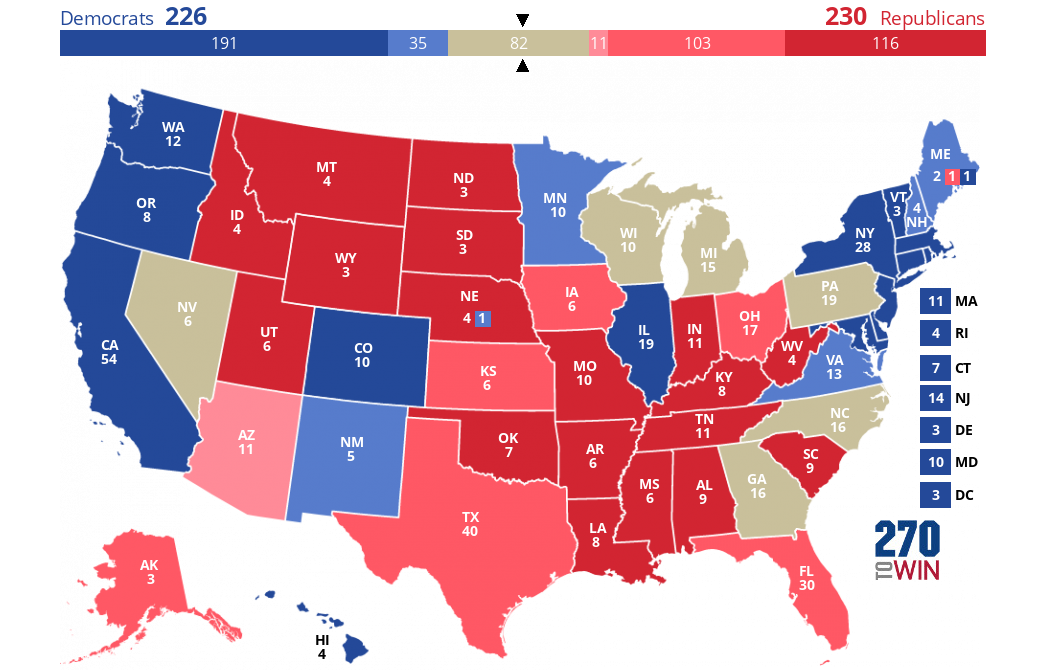
Updated daily, this is an electoral map projection based on JHK Forecasts presidential election forecast. This data-driven model was created by Jack Kersting.
Outputs from the model drive much of the 270toWin 2020 election simulator.
The Toss-Up tan color is used where neither candidate currently has a 60% or higher chance of winning. The colored gradients are used to show higher probabilities for Biden or Trump, deepening as the likelihood of winning increases: Light (60%+), Medium (85%+), Dark (95%+).
Use this map as a starting point to create and share your own 2020 presidential election forecast.

VT |
|
NH |
|
MA |
|
RI |
|
CT |
|
NJ |
|
DE |
|
MD |
|
DC |

Map :
Barron Trump Will Be a Delegate at the GOP Convention
GOP Staffer Engaged with Antisemitic Posts
How Trump’s Allies Amplify His Truth Social Posts
Bonus Quote of the Day
Biden Leads In Wisconsin
Headlines
Overview and Live Results: Indiana Primary
Four competitive GOP primaries in deep red U.S. House seats will likely provide the most election day suspense
Live Results: Texas State Senate Special, Lubbock Mayor
The lone Senate vacancy will be filled, while voters in the nation's 85th largest city will choose a mayor
Live Results: New York Congressional District 26 Special Election
There is also a legislative special election runoff in Alabama
Live Results: Puerto Rico Democratic Primary
The territory is expected to add 55 delegates to Joe Biden's total, which now exceeds 3,300
Overview and Live Results: Pennsylvania Primary
Keystone State voters will weigh in on both presidential and downballot contests
Customize your map by changing one or more states. Return here to share it. Share or Embed your Map: Select 'Share Map' button above. Share or Embed your Map: