Arizona 2024 Presidential Election Polls
Biden vs. Trump
| Source | Date | Sample | Biden | Trump | Other | |
|---|---|---|---|---|---|---|
| Average of 4 Polls† | 40.3% | 44.8% | - | |||
| Bloomberg / Morning Consult | 4/24/2024 | 801 RV ±3% | 42% | 49% | 9% | |
| Wall Street Journal | 4/02/2024 | 600 RV ±4% | 42% | 47% | 11% | |
| RABA Research | 4/01/2024 | 503 RV ±4.4% | 36% | 39% | 25% | |
| Bloomberg / Morning Consult | 3/26/2024 | 796 RV ±3% | 43% | 48% | 9% | |
| Redfield & Wilton | 3/25/2024 | 516 LV ±4% | 41% | 44% | 15% | |
| Emerson College | 3/20/2024 | 1,000 RV ±3% | 44% | 48% | 8% | |
| Fox News | 3/13/2024 | 1,121 RV ±3% | 45% | 49% | 6% | |
| Bloomberg / Morning Consult | 2/29/2024 | 798 RV ±3% | 43% | 49% | 8% | |
| Emerson College | 2/22/2024 | 1,000 RV ±3% | 43% | 46% | 11% | |
| Bloomberg / Morning Consult | 1/31/2024 | 800 RV ±3% | 44% | 47% | 9% | |
Show:
Including Third Parties and Independents
A separate average calculation for the subset of polls that have a question that names one or more notable candidates in addition to Biden and Trump. The inclusion of these names can significantly influence the polling average.
| Source | Date | Sample | Biden | Stein | Kennedy | West | Trump | Other | |
|---|---|---|---|---|---|---|---|---|---|
| Average of 3 Polls† | 38.3% | 0.3% | 9.0% | 2.0% | 43.0% | - | |||
| Bloomberg / Morning Consult | 4/24/2024 | 801 RV ±3% | 40% | 0% | 7% | 2% | 46% | 5% | |
| Wall Street Journal | 4/02/2024 | 600 RV ±4% | 34% | 1% | 13% | 2% | 39% | 11% | |
| Bloomberg / Morning Consult | 3/26/2024 | 796 RV ±3% | 37% | 1% | 12% | 2% | 43% | 5% | |
| Redfield & Wilton | 3/25/2024 | 516 LV ±4% | 41% | 0% | 7% | - | 44% | 8% | |
| Emerson College | 3/20/2024 | 1,000 RV ±3% | 38% | 2% | 7% | 1% | 46% | 6% | |
| Fox News | 3/13/2024 | 1,121 RV ±3% | 39% | 2% | 10% | 1% | 43% | 5% | |
| Bloomberg / Morning Consult | 2/29/2024 | 798 RV ±3% | 36% | 1% | 9% | 1% | 45% | 8% | |
| Emerson College | 2/22/2024 | 1,000 RV ±3% | 37% | 1% | 8% | 1% | 43% | 10% | |
| Bloomberg / Morning Consult | 1/31/2024 | 800 RV ±3% | 35% | 1% | 10% | 1% | 43% | 10% | |
| Redfield & Wilton | 1/08/2024 | 659 LV | 35% | - | 10% | - | 41% | 14% | |
Show:
†The average includes all polls within seven days of the date of the most recent poll, limited to one poll from any source. If there are fewer than five, the window is expanded to 30 days or five polls, whichever comes first. In the latter scenario, if there are multiple qualifying polls on the same calendar date as the oldest poll used, those will also be included.
When did it last happen?
This feature shows the most recent election where the state voted with or against the presidential winner in each party. Click the year to see the corresponding electoral map and results.Arizona Winner
Biden
Trump
Romney
Election Winner
Biden
Trump
Obama
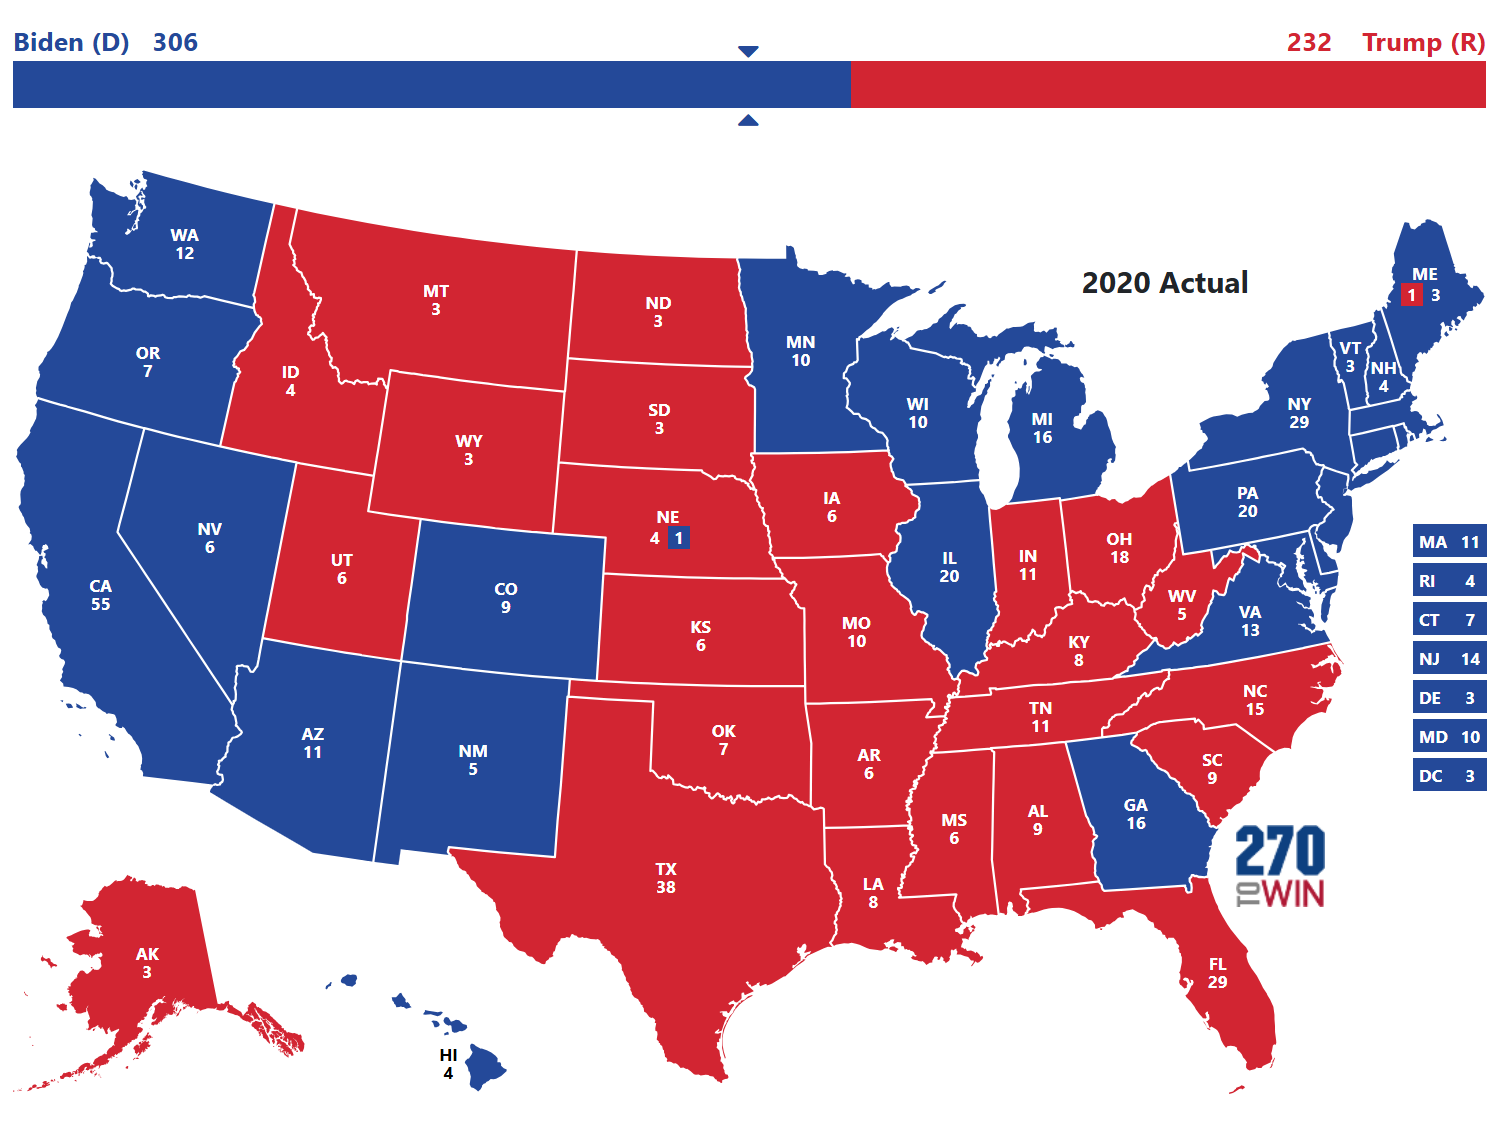
2020
2016
2012
Never