JHK Forecasts Presidential Election Forecast
Current as of Map Timestamp
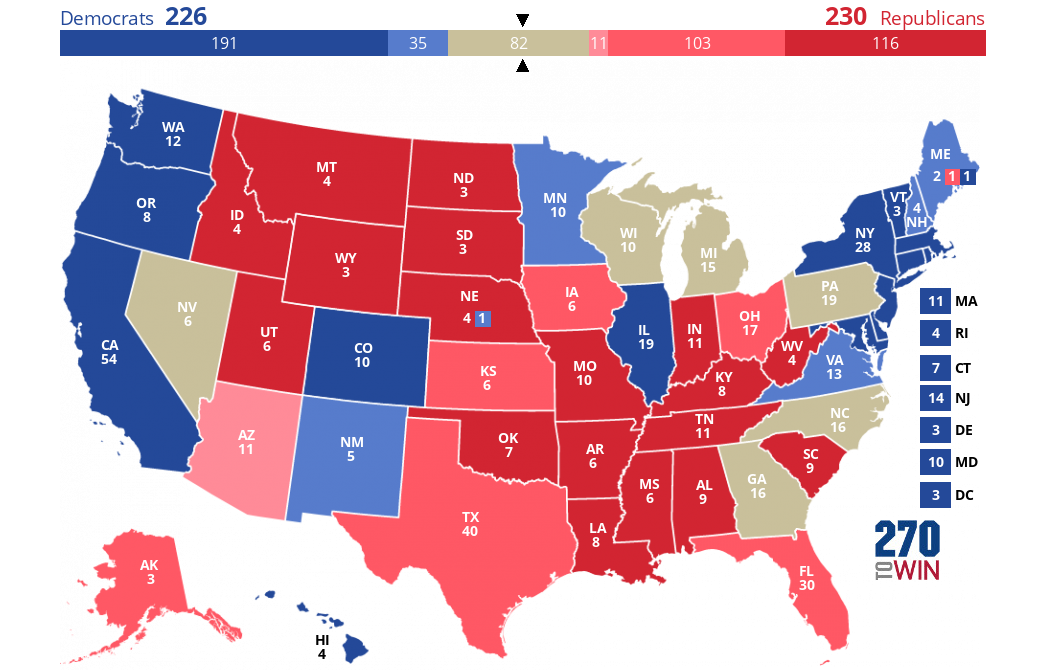
Updated daily, this is an electoral map projection based on JHK Forecasts presidential election forecast. This data-driven model was created by Jack Kersting.
Outputs from the model drive much of the 270toWin 2020 election simulator.
The Toss-Up tan color is used where neither candidate currently has a 60% or higher chance of winning. The colored gradients are used to show higher probabilities for Biden or Trump, deepening as the likelihood of winning increases: Light (60%+), Medium (85%+), Dark (95%+).
Use this map as a starting point to create and share your own 2020 presidential election forecast.

VT |
|
NH |
|
MA |
|
RI |
|
CT |
|
NJ |
|
DE |
|
MD |
|
DC |

Map :
One in Ten Republicans Less Likely to Vote for Trump
Bonus Quote of the Day
Biden Goes All-In Calling Trump a ‘Convicted Felon’
Republicans Join Trump’s Attacks on Justice System
Trump Verdict Hardens Many Views, but Changes Some
Headlines
Overview and Live Results: Texas Primary Runoff Elections
30 runoffs for U.S. House and State Legislative seats where no candidate received a majority in the March 5 primary
Idaho Democratic Caucus Results
Joe Biden received 95%, winning all 23 pledged delegates
Live Results: Georgia, Idaho, Kentucky, and Oregon Primaries
Four states hold their down-ballot primaries this Tuesday, with presidential contests also on the ballot in Kentucky and Oregon
Overview and Live Results: California Congressional District 20 Special Election
The winner will complete the term of former Speaker Kevin McCarthy, who resigned at the end of last year.
Live Results: Maryland, Nebraska, West Virginia Primaries; North Carolina Runoffs
Senate Democratic Primary in Maryland is the marquee race, although there are several competitive House races of interest
Customize your map by changing one or more states. Return here to share it. Share or Embed your Map: Select 'Share Map' button above. Share or Embed your Map: