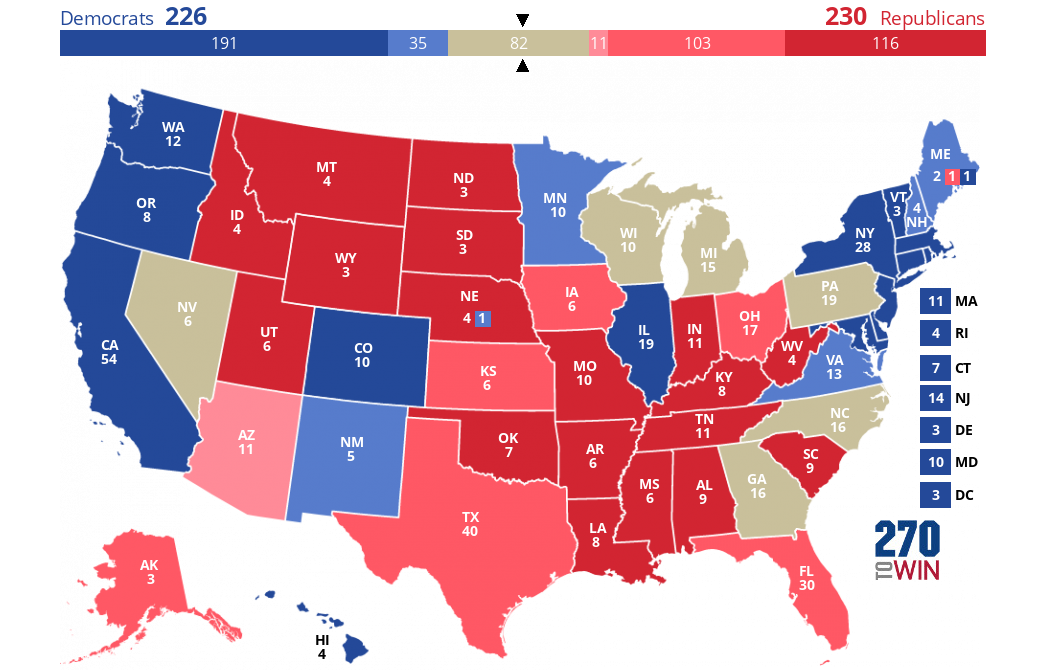
2020 Electoral Map Based on Polls
Current as of Map Timestamp
Updated three times daily, this map tracks the electoral vote count for the 2020 presidential election based on polling. The 2016 election margin, rounded to the nearest 1%, is used where there are no polls.
Use the timeline feature to view the map based on the final update each day.
States where the margin is <5% are shown as toss-up. Leaning is <10%, likely <15%. Safe is 15% or higher.
Use this map as a starting point to create and share your own 2020 presidential election forecast.

VT |
|
NH |
|
MA |
|
RI |
|
CT |
|
NJ |
|
DE |
|
MD |
|
DC |

Map :
Right-Wing Pastor Claims Jesus Told Her To Run
Biden and Democrats Seize on Trump’s Striking Interview
Trump to Hold Rally In Wisconsin
Trump Would Not Rule Out Violence After the Election
Trump Quickly Fundraises Off Contempt Citation
Headlines
Live Results: New York Congressional District 26 Special Election
There is also a legislative special election runoff in Alabama
Live Results: Puerto Rico Democratic Primary
The territory is expected to add 55 delegates to Joe Biden's total, which now exceeds 3,300
Overview and Live Results: Pennsylvania Primary
Keystone State voters will weigh in on both presidential and downballot contests
Wyoming and Puerto Rico Republican Nominating Contests
The Wyoming State Convention concludes a multi-step nominating process, while a party-run primary takes place in the U.S. territory
Kansas Republican Rep. Jake LaTurner Not Seeking Reelection
His retirement announcement cites a desire to spend more time with his family
Customize your map by changing one or more states. Return here to share it. Share or Embed your Map: Select 'Share Map' button above. Share or Embed your Map: