Electoral Map: Blue or Red States Since 2000
As the 2016 election cycle approached, the electoral map had become pretty predictable. All but 10 states1 1Plus one congressional district in Nebraska had voted consistently Democratic or Republican for (at least) the prior four consecutive presidential elections. For the GOP, this represented 179 electoral votes. The Democratic states, comprising 242 electoral votes had all actually gone blue since 1992 - six straight elections. Further highlighting this polarization: While relatively competitive overall, only four states (FL, NC, OH, VA) were decided by less than 5% popular vote margin in the 2012 presidential election.
Same Since 2000: After 2020 Election
The last two elections have seen five states and a district in Maine break their same party streaks. To win in 2016, Donald Trump broke through some of the 'blue wall' of 242 electoral votes that had voted Democratic in each presidential election since at least 1992. Pennsylvania, Michigan, Wisconsin and one district in Maine voted Republican in 2016.
In 2020, Joe Biden won Georgia and Arizona, states that had last voted Democratic in 1992 and 1996, respectively.
All five of the aforementioned states were decided by 1% or less in the year (2016 or 2020) they came off this map.
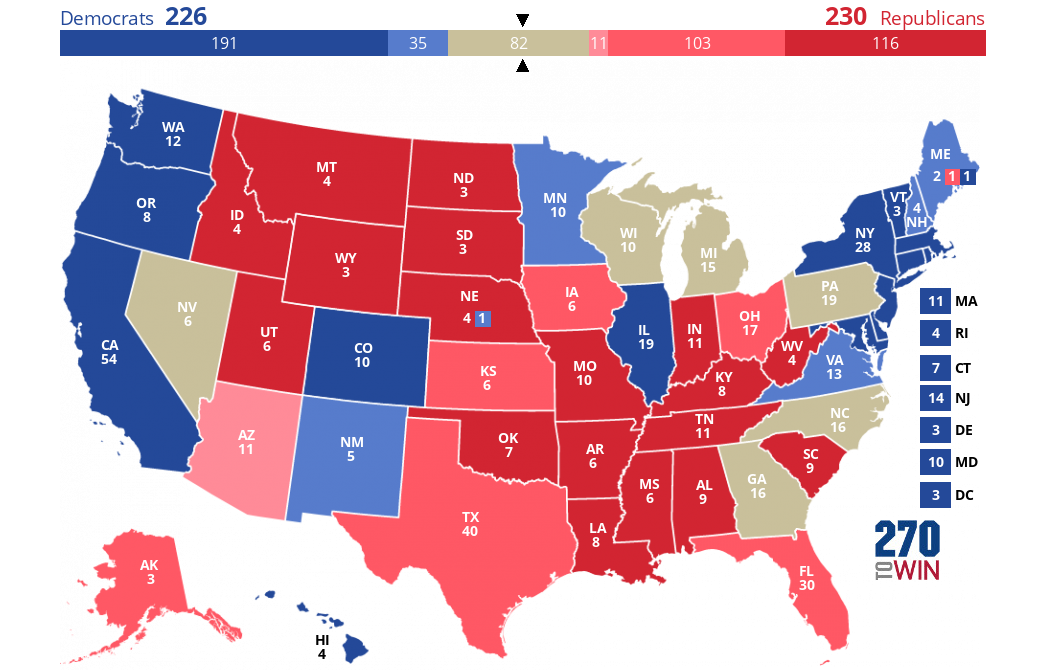
Note that the next image reflects the electoral map as of 2024. Had there been no changes, Democrats would have 195, Republicans 152. To see what's changed, click the image. On the resulting URL, usee the '2020' or 'Change' buttons above the map
If you're curious how long the streak is for each state, visit our 'Same Since' Electoral Map Timeline.