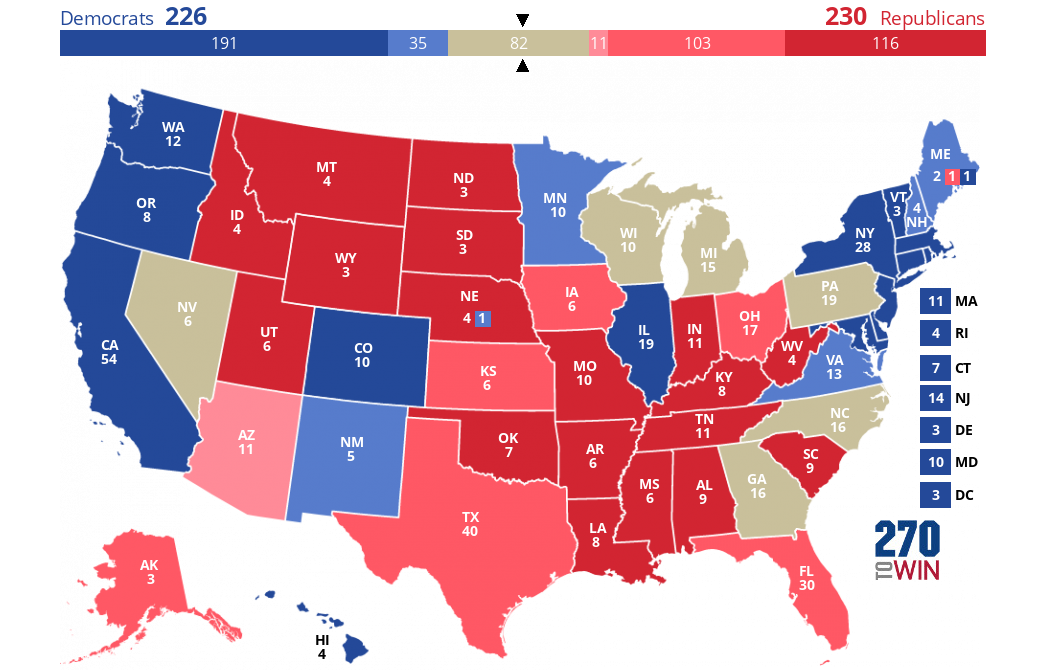
2020 Electoral Map Based on Polls
Current as of Map Timestamp
Updated three times daily, this map tracks the electoral vote count for the 2020 presidential election based on polling. The 2016 election margin, rounded to the nearest 1%, is used where there are no polls.
Use the timeline feature to view the map based on the final update each day.
States where the margin is <5% are shown as toss-up. Leaning is <10%, likely <15%. Safe is 15% or higher.
Use this map as a starting point to create and share your own 2020 presidential election forecast.

VT |
|
NH |
|
MA |
|
RI |
|
CT |
|
NJ |
|
DE |
|
MD |
|
DC |

Map :
Quote of the Day
Trump’s Trial and Campaign Collide
Democrats In Crossover Districts Outraise Republicans
Biden to Deliver Speech on Abortion In Florida
David McCormick’s ‘Modest’ Upbringing Wasn’t So Modest
Headlines
Kansas Republican Rep. Jake LaTurner Not Seeking Reelection
His retirement announcement cites a desire to spend more time with his family
Live Results: Alabama Congressional Primary Runoff, Michigan State House Special Elections
The 2nd Congressional District, open due to redistricting, represents a Democratic pick-up opportunity in the fall
Live Results: Alaska and Wyoming Democratic Presidential Contests
Party run events in these two states will add to President Biden's Delegate Advantage
Uncontested: 2024 U.S. House Races with Single Major Party Participation
These are elections where only one of the two major parties is on the general election ballot
Live Results: Georgia State House Special Election
Three Republicans are looking to replace long-time State Rep. Richard Smith, who died in January
Customize your map by changing one or more states. Return here to share it. Share or Embed your Map: Select 'Share Map' button above. Share or Embed your Map: