A Handy Chart: Electoral Votes Since 1900
By 270toWin Staff
July 19, 2017
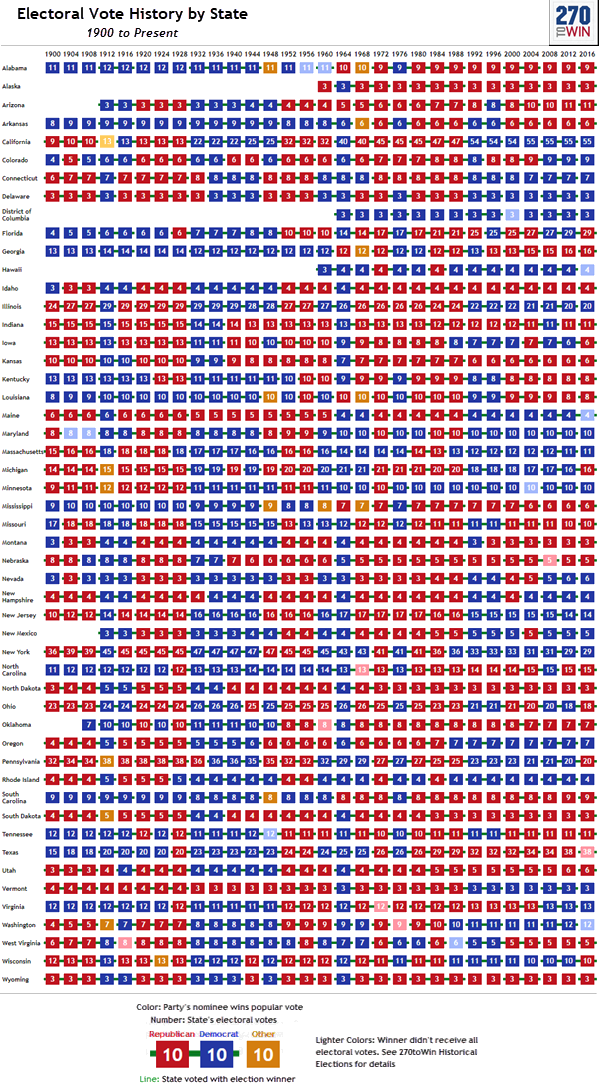
The chart below shows how individual states have voted in each presidential election since 1900. For each state/year, you can view:
- The number of electoral votes allocated to the state
- Which party's nominee won the popular vote
- If the state voted with the person that won the presidential election
- If the winner received fewer than the total electoral votes available
For more information, including a larger version, click/tap the chart, or see the state electoral vote history page.
Headlines
Overview and Live Results: Pennsylvania Primary
Keystone State voters will weigh in on both presidential and downballot contests
Wyoming and Puerto Rico Republican Nominating Contests
The Wyoming State Convention concludes a multi-step nominating process, while a party-run primary takes place in the U.S. territory
Kansas Republican Rep. Jake LaTurner Not Seeking Reelection
His retirement announcement cites a desire to spend more time with his family
Live Results: Alabama Congressional Primary Runoff, Michigan State House Special Elections
The 2nd Congressional District, open due to redistricting, represents a Democratic pick-up opportunity in the fall
Live Results: Alaska and Wyoming Democratic Presidential Contests
Party run events in these two states will add to President Biden's Delegate Advantage