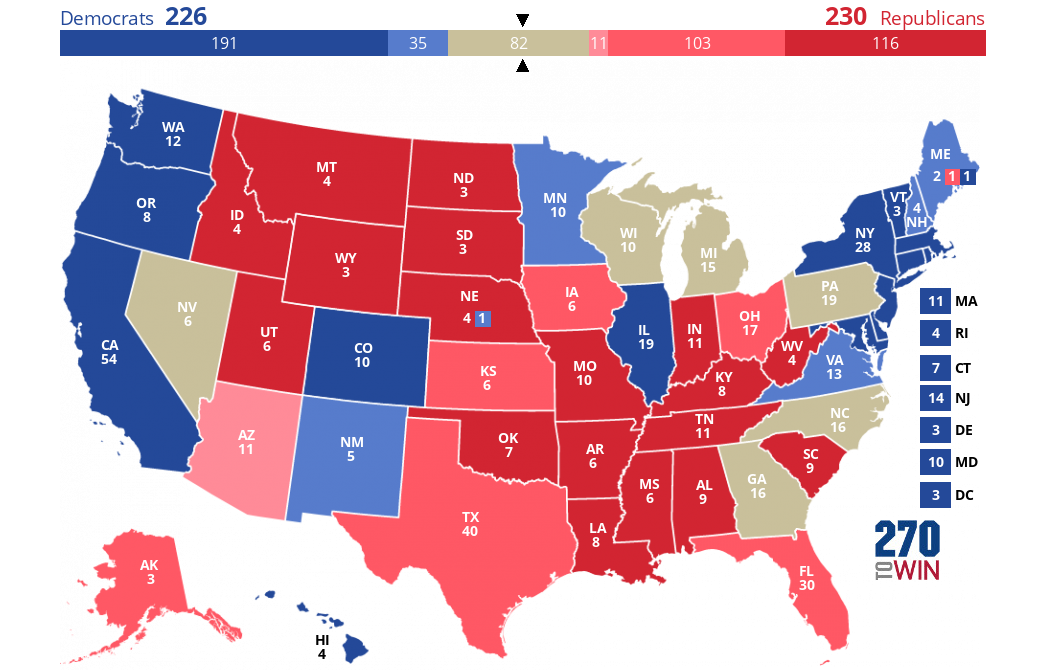
The Probability of 270: How are those Probabilities Calculated?
By 270toWin Staff
September 8, 2008
**If you are reading this directly instead of linking here, this relates to the section under the interactive map on the 270toWin home page called "The Probability of 270".**
However you get here, it is important to point out up front that the outcome of this exercise is statistically valid based on current polls and is not a projection of the election. The election could turn out completely differently than the displayed results but it doesn't mean that the underlying polls used were inaccurate. They could have been perfectly accurate when they were taken, but we'll never know since we only vote on Election Day. So don't read more into these numbers than is actually there.
Although it is rarely presented this way, statistical theory makes it possible to take the results of a state poll and calculate the probability that either candidate will actually win that state's popular vote, and thus collect its electoral votes. For example, let's say that a poll with a sample size of 600 for Missouri comes back 48% for Candidate A and 44% for Candidate B, with 8% other, undecided or some other response. Since a victory by 10 votes is the same as a victory by one million votes --- the winner gets the full electoral college bounty for the state, the only question we are trying to answer is: "Given these results, what is the probability that Candidate A will actually get more votes than Candidate B in Missouri?" In this specific case, the answer is about 85%.
It is important to note that, for example, a 4% spread doesn't always equate to 85%. The number will vary based on the number of people sampled and will also vary based on the proportion of undecided/other is in the results. Smaller sample sizes and more undecided responses lead to greater uncertainty in the outcome, pushing the probabilities toward 50-50. Of course, a smaller spread between candidate A & B will also result in a probability closer to 50-50.
For those interested in even more detail, see below. An example is provided inside the < >.
- The input for each state is a poll (or average of polls, where appropriate), including % for each candidate and sample size. Big assumption in all of this is that the polls are statistically valid with a normal distribution.
- From the above, a standard error (standard deviation) can be calculated <4.3%>
- With the above pieces of information, a probability can be calculated using a normal distribution function <94.7% McCain, 5.3% Obama. This tells us that there is a 94.7% chance that McCain is ahead of Obama in the Ga. popular vote, if the election were today. Or, perhaps a better way to say it is that we can say with 94.7% confidence that McCain leads>
- Since the electoral vote is 'all or none', this statistic is all we are trying to figure out for each state.
- To get an aggregate probability across all remaining unselected (tan color) states in the map, we take the above statistic as calculated for each of those states and calculate the probability of each outcome. For example, if Georgia and Ohio remain undecided, the outcomes could be MM, MO, OM or OO, where M=McCain wins and O=Obama wins in Georgia, Ohio. <Let's assume the Georgia example described earlier and let's say the Ohio probabilities are 50/50. These are the possibilities:
- MM = .947 * .5 (47.3% chance of occurring)
- MO = .937* .5 = .473
- OM = .053 * .5 = .027
- OO = .053* .5 = .027>
- The final step is to take the electoral votes associated with each outcome and figure out the winner.
- You may wonder why we only show the "Probability of 270" calculations with 12 or fewer states remaining. The reason we limit is that the permutations become exponentially larger as more states remain unselected, since every possible combination must be considered in order to calculate the aggregate probability correctly. With many people simultaneously on 270toWin and with the calculation updating dynamically with each click of a state, it really bogs down the server if we open it up to more than 12 states.

